Translate this page into:
Marked Disparities in COVID-19 Vaccination among US Children and Adolescents by Racial/Ethnic, Socioeconomic, Geographic, and Health Characteristics, United States, December 2021 – April 2022
* Corresponding author email: gsingh@mchandaids.org
-
Received: ,
Accepted: ,
This is an open-access article distributed under the terms of the Creative Commons Attribution-Noncommercial-Share Alike 4.0 Unported, which permits unrestricted use, distribution, and reproduction in any medium, provided the original work is properly cited.
Abstract
Background:
The COVID-19 pandemic has had a substantial adverse impact on the health and well-being of populations in the United States (US) and globally. Although COVID-19 vaccine disparities among US adults aged ≥18 years are well documented, COVID-19 vaccination inequalities among US children are not well studied. Using the recent nationally representative data, we examine disparities in COVID-19 vaccination among US children aged 5-17 years by a wide range of social determinants and parental characteristics.
Methods:
Using the US Census Bureau’s Household Pulse Survey from December 1, 2021 to April 11, 2022 (N=86,335), disparities in child vaccination rates by race/ethnicity, socioeconomic status, health insurance, parental vaccination status, parental COVID-19 diagnosis, and metropolitan area were modeled by multivariate logistic regression.
Results:
During December 2021–April 2022, an estimated 40.1 million or 57.2% of US children aged 5-17 received COVID-19 vaccination. Vaccination rates were lowest among children of parents aged 25-34 (34.9%) and highest among children of parents aged 45-54 (69.2%). Children of non-Hispanic Black parents, divorced/separated and single individuals, parents with lower education and household income levels, renters, not-employed parents, the uninsured, and parents without COVID-19 vaccination or with COVID-19 diagnoses had significantly lower rates of vaccination. Controlling for covariates, Asian and Hispanic children aged 5-17 had 134% and 47% higher odds of receiving vaccination than their non-Hispanic White counterparts. Children of parents with a high school education had 47% lower adjusted odds of receiving vaccination than children of parents with a master’s degree or higher. Children with annual household income <$25,000 had 48% lower adjusted odds of vaccination than those with income ≥$200,000. Although vaccination rates were higher among children aged 12-17 than among children aged 5-11, sociodemographic patterns in vaccination rates were similar. Parental vaccination status was the strongest predictor of children’s vaccination status. Vaccination rates for children aged 5-17 ranged from 49.6% in Atlanta, Georgia to 82.6% in San Francisco, California.
Conclusion and Global Health Implications:
Ethnic minorities, socioeconomically-disadvantaged children, uninsured children, and children of parents without COVID-19 vaccination or with COVID-19 diagnoses had significantly lower vaccination rates. Equitable vaccination coverage among children and adolescents is critical to reducing inequities in COVID-19 health outcomes in the US and globally.
Keywords
COVID-19
Pandemic
Vaccination
Children
Adolescents
Disparities
Race/Ethnicity
Socioeconomic Status
Social Determinants
Vaccine Equity

1. Introduction
The coronavirus disease (COVID-19) pandemic has had a devastating impact on the health and well-being of populations in the United States and globally over the past two years, leading to widespread social and economic disruptions, social isolation, mental health problems, reduced access to healthcare and welfare services, excess premature mortality, and declines in life expectancy.1–8 US has been one of the most seriously affected countries by the pandemic, with 89.7 million confirmed COVID-19 cases and 1.02 million deaths as of July 15, 2022,8 in comparison to 557,917,904 confirmed cases and 6,358,899 deaths globally.2
The disease burden associated with COVID-19 has been substantial among US children. As of July 15, 2022, approximately 14.0 million COVID-19 cases and 1,694 deaths for US children have been reported since the start of the pandemic in March 2020.9 The number of COVID-19 cases among children represents 17.5% of all US cases. The number of COVID-related hospitalizations for children totaled 138,775 from August 1, 2020 through July 15, 2022.9 Rates of hospitalization associated with COVID-19 for children aged 0-17 increased from 0.14 per 100,000 population on August 1, 2020 to 0.46 on August 8, 2021 to 1.25 on January 18, 2022.9
After the Food and Drug Administration’s (FDA) emergency use authorization, the Centers for Disease Control and Prevention (CDC) recommended COVID-19 vaccination for the first time for adolescents aged 12-15 years on May 12, 2021,10 and children aged 5-11 years on November 2, 2021.11 COVID-19 vaccination for children and adolescents has been supported to promote herd/population immunity and to tackle the disproportionate impact of COVID-19 on morbidity, mental health, and educational outcomes among low-socioeconomic communities and racial/ethnic minorities.12,13 Despite benefits outweighing known or potential risks associated with vaccination, children’s COVID-19 vaccination rates remain lower than for other age groups.9
A few studies have examined factors associated with parents’ COVID-19 vaccination intention for their children. According to one study, older and highly educated US parents were very or somewhat likely to have their child get the COVID-19 vaccine, but parents’ demographic characteristics were not independently associated with the vaccination intention.14 In this study, the strongest predictor was whether parents received or were likely to receive a COVID-19 vaccine themselves.14 Child’s influenza vaccination and trust in the child’s doctor, social media, and government approval process for COVID-19 vaccine were also associated with parents’ vaccination intention.14 A Canadian study documented a similar finding on the strong association between parents’ vaccination status and the vaccination intention for their child.15 Vaccination intention among Canadian parents was associated with their employment status, child’s influenza vaccination, parents’ COVID-19 vaccination status, belief in the necessity and safety of COVID-19 vaccination, and whether COVID-19 vaccine was tested in children.15
Although vaccine data for US children have been available by race/ethnicity and geography for some time,9,16,17 a comprehensive analysis of COVID-19 vaccination disparities among US children by a wide range of social determinants, such as parental age, gender, race/ethnicity, marital status, education, household income, employment status, housing tenure, health status, health insurance status, and geographic region or metropolitan area, has not yet been conducted. Such analyses of disparities are urgently needed to ensure more equitable vaccine access and prevent widening disparities in COVID-19 health outcomes among children and youth.9,16,17 To address the existing gaps in research, we use a large nationally representative survey to examine disparities in COVID-19 vaccination rates among US children aged 5-17 years during the ongoing coronavirus pandemic.
2. Methods
2.1. Data
We used pooled data from five consecutive samples of the US Census Bureau’s Household Pulse Survey (HPS) conducted between December 2021 and April 2022. The five independent HPS samples that included information for vaccination among children aged 5-11 and 12-17 years were: Week 40, December 1-13, 2021; Week 41, December 29, 2021–January 10, 2022; Week 42, January 26–February 7, 2022; Week 43, March 2–14, 2022; and Week 44, March 30–April 11, 2022.18 The HPS is a national sample household survey in which data on socioeconomic, demographic, physical and mental health, food insecurity, childcare, and healthcare characteristics, including health insurance coverage, COVID-19 diagnosis and vaccination, and access to telehealth during the COVID-19 pandemic are collected in near real-time via email and internet. The survey was developed as a rapid response survey in order to track the social and economic impacts of COVID-19 pandemic on American households on a weekly or bi-weekly basis in partnership with several federal statistical agencies.19,20 Information collected in the survey is based on self-reports by respondents aged 18 years and older. The HPS uses a systematic sample design and is representative of the civilian non-institutionalized population of the US. Substantive and methodological details of the survey are available elsewhere.18–20
2.2. Measurement of Childhood COVID-19 Vaccination and Covariates
The binary outcome variable, the receipt of COVID-19 vaccine in children, was derived from the question, “Have any of the children living in your household received at least one dose of a COVID-19 vaccine?” with children receiving the vaccine coded as 1 and those not receiving the vaccine coded as 0. The pooled sample size from December 1, 2021 to April 11, 2022 HPS was 86,335 for children aged 5-17 years for whom the vaccination status was available.18
Based on previous research and the social determinants of health framework, we selected the following parental or household covariates: parental age, gender, race/ethnicity, marital status, region or metropolitan statistical area (MSA) of residence, educational attainment, household income, housing tenure, employment status, health insurance status, and prior COVID-19 diagnosis, and COVID-19 vaccination status.6,9,18,21 Except for age, no other demographic characteristics for children were available. The covariates were measured as shown in Tables 1 and 2.
| Parental or Household Characteristics | Unadjusted | Unadjusted | Adjusted | Adjusted | ||||||
|---|---|---|---|---|---|---|---|---|---|---|
| Preva-lence | SE | OR1 | 95% CI | OR2 | 95% CI | Preva-lence | SE | |||
| Total population | 57.18 | 0.36 | ||||||||
| Parental age (years) | ||||||||||
| 18-24 | 67.28 | 1.78 | 1.87 | 1.30 | 2.67 | 2.15 | 1.44 | 3.11 | 67.27 | 1.53 |
| 25-34 | 34.87 | 1.03 | 0.49 | 0.35 | 0.68 | 0.55 | 0.38 | 0.71 | 43.63 | 1.04 |
| 35-44 | 55.67 | 0.53 | 1.14 | 0.82 | 1.58 | 1.08 | 0.76 | 1.48 | 56.34 | 0.52 |
| 45-54 | 69.24 | 0.59 | 2.04 | 1.47 | 2.83 | 1.69 | 1.19 | 2.39 | 63.65 | 0.56 |
| 55-64 | 61.13 | 1.04 | 1.43 | 1.02 | 1.99 | 1.16 | 0.81 | 1.76 | 57.58 | 0.92 |
| 65-74 | 58.73 | 1.89 | 1.29 | 0.90 | 1.85 | 1.02 | 0.70 | 1.57 | 55.25 | 1.57 |
| ≥75 | 52.44 | 4.12 | 1.00 | reference | 1.00 | reference | 54.92 | 3.14 | ||
| Parental sex at birth | ||||||||||
| Male | 59.80 | 0.61 | 1.00 | reference | 1.00 | reference | 57.83 | 0.57 | ||
| Female | 55.07 | 0.41 | 0.82 | 0.78 | 0.87 | 0.93 | 0.86 | 1.01 | 56.68 | 0.40 |
| Parental race/ethnicity | ||||||||||
| Non-Hispanic White | 54.34 | 0.41 | 1.00 | reference | 1.00 | reference | 54.19 | 0.43 | ||
| Non-Hispanic Black | 51.87 | 1.06 | 0.91 | 0.83 | 0.99 | 1.17 | 1.04 | 1.31 | 56.86 | 0.96 |
| Asian | 83.28 | 0.94 | 4.18 | 3.65 | 4.79 | 2.34 | 2.00 | 2.73 | 67.57 | 1.10 |
| Other and multiple race3 | 52.85 | 1.53 | 0.94 | 0.83 | 1.07 | 1.19 | 1.03 | 1.39 | 57.24 | 1.28 |
| Hispanic | 60.38 | 0.92 | 1.28 | 1.18 | 1.39 | 1.47 | 1.32 | 1.63 | 60.63 | 0.76 |
| Parental marital status | ||||||||||
| Married | 60.49 | 0.42 | 1.00 | reference | 1.00 | reference | 57.42 | 0.46 | ||
| Widowed | 49.05 | 2.08 | 0.63 | 0.53 | 0.74 | 0.81 | 0.64 | 1.02 | 53.85 | 2.02 |
| Divorced/separated | 52.18 | 0.88 | 0.71 | 0.66 | 0.77 | 0.93 | 0.83 | 1.03 | 56.17 | 0.87 |
| Single | 51.56 | 0.94 | 0.70 | 0.64 | 0.75 | 1.00 | 0.89 | 1.13 | 57.46 | 0.88 |
| Geographic region | ||||||||||
| Northeast | 66.01 | 0.87 | 1.00 | reference | 1.00 | reference | 60.99 | 0.77 | ||
| South | 51.08 | 0.60 | 0.54 | 0.49 | 0.59 | 0.67 | 0.60 | 0.74 | 54.22 | 0.54 |
| Midwest | 54.63 | 0.65 | 0.62 | 0.57 | 0.68 | 0.83 | 0.75 | 0.93 | 58.01 | 0.57 |
| West | 63.61 | 0.72 | 0.90 | 0.82 | 0.99 | 0.87 | 0.78 | 0.98 | 58.81 | 0.65 |
| Parental education (years of school completed) | ||||||||||
| Less than high school (<12) | 55.75 | 1.51 | 0.37 | 0.32 | 0.42 | 0.76 | 0.64 | 0.90 | 59.65 | 1.26 |
| High school (12) | 46.86 | 0.81 | 0.26 | 0.24 | 0.28 | 0.53 | 0.48 | 0.59 | 53.52 | 0.74 |
| Some college (13-15) | 54.22 | 0.52 | 0.34 | 0.32 | 0.37 | 0.61 | 0.56 | 0.66 | 55.87 | 0.47 |
| College degree (16) | 68.20 | 0.49 | 0.62 | 0.58 | 0.67 | 0.77 | 0.71 | 0.82 | 59.72 | 0.53 |
| Graduate degree or higher (≥17) | 77.45 | 0.43 | 1.00 | reference | 1.00 | reference | 63.91 | 0.56 | ||
| Household income in 2020 ($) | ||||||||||
| <25,000 | 46.52 | 1.25 | 0.21 | 0.18 | 0.24 | 0.52 | 0.43 | 0.63 | 54.80 | 1.25 |
| 25,000-34,999 | 51.81 | 1.32 | 0.26 | 0.22 | 0.30 | 0.53 | 0.44 | 0.64 | 55.17 | 1.12 |
| 35,000-49,999 | 54.13 | 1.27 | 0.28 | 0.24 | 0.33 | 0.57 | 0.48 | 0.69 | 56.43 | 1.19 |
| 50,000-74,999 | 54.42 | 1.05 | 0.28 | 0.25 | 0.33 | 0.54 | 0.47 | 0.63 | 55.55 | 0.91 |
| 75,000-99,999 | 59.38 | 0.99 | 0.35 | 0.30 | 0.40 | 0.59 | 0.51 | 0.68 | 56.86 | 0.96 |
| 100,000-149,999 | 66.36 | 0.82 | 0.47 | 0.41 | 0.54 | 0.67 | 0.58 | 0.77 | 59.00 | 0.86 |
| 150,000-199,999 | 74.08 | 1.09 | 0.68 | 0.58 | 0.80 | 0.77 | 0.66 | 0.89 | 61.25 | 1.04 |
| ≥200,000 | 80.75 | 0.85 | 1.00 | reference | 1.00 | reference | 65.30 | 1.01 | ||
| Unknown | 51.66 | 0.76 | 0.25 | 0.22 | 0.29 | 0.58 | 0.47 | 0.71 | 56.57 | 1.15 |
| Housing tenure | ||||||||||
| Owner | 62.88 | 0.44 | 1.00 | reference | 1.00 | reference | 58.02 | 0.64 | ||
| Renter | 52.44 | 0.79 | 0.65 | 0.61 | 0.70 | 0.94 | 0.85 | 1.04 | 56.96 | 0.78 |
| Parental employment status | ||||||||||
| Employed | 60.23 | 0.41 | 1.00 | reference | 1.00 | reference | 57.48 | 0.45 | ||
| Not employed | 53.88 | 0.68 | 0.77 | 0.72 | 0.82 | 0.99 | 0.91 | 1.08 | 57.34 | 0.61 |
| Recent household job loss | ||||||||||
| Yes | 52.89 | 0.91 | 0.77 | 0.71 | 0.83 | 0.99 | 0.89 | 1.09 | 57.12 | 0.79 |
| No | 59.30 | 0.39 | 1.00 | reference | 1.00 | reference | 57.37 | 0.41 | ||
| Parental health insurance status | ||||||||||
| Insured | 60.45 | 0.39 | 1.00 | reference | 1.00 | reference | 57.61 | 0.50 | ||
| Not insured | 45.59 | 1.60 | 0.55 | 0.48 | 0.62 | 0.75 | 0.63 | 0.88 | 52.61 | 1.47 |
| Parental COVID-19 diagnosis | ||||||||||
| Yes | 49.96 | 0.63 | 0.62 | 0.59 | 0.66 | 0.73 | 0.68 | 0.79 | 53.65 | 0.57 |
| No | 61.62 | 0.43 | 1.00 | reference | 1.00 | reference | 58.98 | 0.42 | ||
| Parental COVID-19 vaccination status | ||||||||||
| Vaccinated | 70.32 | 0.37 | 1.00 | reference | 1.00 | reference | 68.28 | 0.40 | ||
| Not vaccinated | 8.66 | 0.52 | 0.04 | 0.03 | 0.05 | 0.05 | 0.04 | 0.06 | 12.34 | 0.69 |
SE= standard error. OR=odds ratio; CI=confidence interval. 1ORs estimated by logistic model were unadjusted for the effects of other covariates. 2Adjusted by logistic regression model for parental age, gender, race/ethnicity, marital status, region of residence, education, household income, housing tenure, recent household job loss, employment status, insurance status, COVID-19 diagnosis, and COVID-19 vaccination status. 3Consists of American Indians and Alaska Natives, Native Hawaiians and Pacific Islanders, and mixed-race individuals. Chi-square statistics for testing the overall association between each covariate and observed/unadjusted child COVID-19 vaccine rates were statistically significant at p<0.001.
| Parental or Household Characteristics | Children aged 5-11 years (N = 51,657) | Adolescents aged 12-17 years (N = 53,419) | ||||||||||||||
|---|---|---|---|---|---|---|---|---|---|---|---|---|---|---|---|---|
| Unadjusted | Unadjusted | Adjusted | Unadjusted | Unadjusted | Adjusted | |||||||||||
| Preva-lence | SE | OR1 | 95% CI | OR2 | 95% CI | Preva-lence | SE | OR1 | 95% CI | OR2 | 95% CI | |||||
| Total population | 47.68 | 0.45 | 66.11 | 0.44 | ||||||||||||
| Parental age (years) | ||||||||||||||||
| 18-24 | 53.24 | 3.55 | 2.20 | 1.39 | 3.48 | 2.58 | 1.47 | 4.50 | 70.14 | 1.91 | 2.06 | 1.33 | 3.19 | 2.44 | 1.44 | 4.14 |
| 25-34 | 29.87 | 1.05 | 0.82 | 0.56 | 1.20 | 0.93 | 0.58 | 1.49 | 50.61 | 1.93 | 0.90 | 0.59 | 1.38 | 1.11 | 0.67 | 1.82 |
| 35-44 | 52.77 | 0.61 | 2.16 | 1.50 | 3.12 | 1.76 | 1.11 | 2.78 | 60.10 | 0.71 | 1.32 | 0.88 | 1.98 | 1.69 | 1.06 | 2.69 |
| 45-54 | 58.53 | 0.98 | 2.73 | 1.88 | 3.96 | 1.95 | 1.23 | 3.08 | 75.14 | 0.62 | 2.65 | 1.77 | 3.97 | 2.29 | 1.44 | 3.64 |
| 55-64 | 42.81 | 1.75 | 1.45 | 0.98 | 2.14 | 1.07 | 0.67 | 1.72 | 70.92 | 1.07 | 2.14 | 1.42 | 3.23 | 1.86 | 1.17 | 2.98 |
| 65-74 | 51.82 | 2.60 | 2.08 | 1.37 | 3.15 | 1.53 | 0.94 | 2.46 | 65.23 | 2.38 | 1.65 | 1.05 | 2.58 | 1.23 | 0.75 | 2.01 |
| ≥75 | 34.11 | 4.18 | 1.00 | reference | 1.00 | reference | 53.26 | 5.07 | 1.00 | reference | 1.00 | reference | ||||
| Parental sex at birth | ||||||||||||||||
| Male | 50.05 | 0.80 | 1.00 | reference | 1.00 | reference | 68.22 | 0.74 | 1.00 | reference | 1.00 | reference | ||||
| Female | 45.87 | 0.52 | 0.85 | 0.78 | 0.91 | 0.99 | 0.89 | 1.09 | 64.38 | 0.53 | 0.84 | 0.78 | 0.91 | 0.89 | 0.80 | 1.00 |
| Parental race/ethnicity | ||||||||||||||||
| Non-Hispanic White | 45.22 | 0.50 | 1.00 | reference | 1.00 | reference | 62.64 | 0.53 | 1.00 | reference | 1.00 | reference | ||||
| Non-Hispanic Black | 40.48 | 1.26 | 0.82 | 0.74 | 0.92 | 1.13 | 0.99 | 1.30 | 63.17 | 1.33 | 1.02 | 0.91 | 1.15 | 1.27 | 1.07 | 1.50 |
| Asian | 77.31 | 1.32 | 4.13 | 3.54 | 4.81 | 2.42 | 2.04 | 2.88 | 91.85 | 0.95 | 6.72 | 5.22 | 8.65 | 3.87 | 2.86 | 5.23 |
| Other and multiple race3 | 45.81 | 1.84 | 1.02 | 0.88 | 1.19 | 1.32 | 1.09 | 1.60 | 59.07 | 2.01 | 0.86 | 0.73 | 1.02 | 1.13 | 0.92 | 1.39 |
| Hispanic | 49.52 | 1.21 | 1.19 | 1.07 | 1.32 | 1.45 | 1.28 | 1.64 | 70.30 | 1.08 | 1.41 | 1.26 | 1.58 | 1.54 | 1.33 | 1.78 |
| Parental marital status | ||||||||||||||||
| Married | 52.23 | 0.53 | 1.00 | reference | 1.00 | reference | 69.32 | 0.51 | 1.00 | reference | 1.00 | reference | ||||
| Widowed | 36.59 | 2.75 | 0.53 | 0.42 | 0.67 | 0.71 | 0.51 | 0.98 | 57.56 | 2.50 | 0.60 | 0.49 | 0.74 | 1.03 | 0.75 | 1.41 |
| Divorced/separated | 42.59 | 1.20 | 0.68 | 0.61 | 0.75 | 0.92 | 0.80 | 1.06 | 59.59 | 1.06 | 0.65 | 0.59 | 0.72 | 0.91 | 0.78 | 1.05 |
| Single | 37.31 | 1.20 | 0.54 | 0.49 | 0.61 | 0.83 | 0.71 | 0.96 | 62.56 | 1.16 | 0.74 | 0.66 | 0.82 | 1.02 | 0.86 | 1.22 |
| Geographic region | ||||||||||||||||
| Northeast | 56.24 | 1.14 | 1.00 | reference | 1.00 | reference | 74.59 | 1.07 | 1.00 | reference | 1.00 | reference | ||||
| South | 40.98 | 0.76 | 0.54 | 0.48 | 0.60 | 0.67 | 0.59 | 0.76 | 60.93 | 0.76 | 0.53 | 0.47 | 0.60 | 0.63 | 0.54 | 0.74 |
| Midwest | 46.42 | 0.80 | 0.67 | 0.60 | 0.75 | 0.90 | 0.79 | 1.02 | 62.38 | 0.81 | 0.56 | 0.50 | 0.64 | 0.71 | 0.60 | 0.84 |
| West | 54.56 | 0.94 | 0.93 | 0.83 | 1.05 | 0.90 | 0.78 | 1.03 | 72.02 | 0.87 | 0.88 | 0.76 | 1.01 | 0.83 | 0.70 | 0.99 |
| Parental education (years of school completed) | ||||||||||||||||
| Less than high school (<12) | 44.35 | 2.02 | 0.31 | 0.27 | 0.37 | 0.74 | 0.59 | 0.92 | 62.32 | 1.74 | 0.31 | 0.27 | 0.37 | 0.64 | 0.51 | 0.81 |
| High school (12) | 36.91 | 1.02 | 0.23 | 0.21 | 0.26 | 0.52 | 0.46 | 0.59 | 56.83 | 0.99 | 0.25 | 0.22 | 0.28 | 0.48 | 0.42 | 0.56 |
| Some college (13-15) | 42.91 | 0.66 | 0.30 | 0.27 | 0.32 | 0.56 | 0.51 | 0.62 | 65.00 | 0.62 | 0.35 | 0.32 | 0.39 | 0.57 | 0.50 | 0.64 |
| College degree (16) | 59.39 | 0.65 | 0.58 | 0.53 | 0.62 | 0.70 | 0.65 | 0.76 | 78.11 | 0.58 | 0.68 | 0.61 | 0.75 | 0.81 | 0.72 | 0.90 |
| Graduate degree or higher (≥17) | 71.72 | 0.59 | 1.00 | reference | 1.00 | reference | 84.05 | 0.50 | 1.00 | reference | 1.00 | reference | ||||
| Household income in 2020 ($) | ||||||||||||||||
| <25,000 | 36.54 | 1.49 | 0.19 | 0.16 | 0.23 | 0.50 | 0.40 | 0.64 | 55.97 | 1.55 | 0.23 | 0.19 | 0.29 | 0.56 | 0.42 | 0.74 |
| 25,000-34,999 | 40.68 | 1.59 | 0.23 | 0.19 | 0.27 | 0.52 | 0.42 | 0.65 | 62.71 | 1.59 | 0.31 | 0.25 | 0.38 | 0.61 | 0.47 | 0.79 |
| 35,000-49,999 | 44.34 | 1.59 | 0.26 | 0.22 | 0.32 | 0.56 | 0.45 | 0.69 | 64.04 | 1.52 | 0.33 | 0.26 | 0.40 | 0.64 | 0.49 | 0.84 |
| 50,000-74,999 | 45.13 | 1.31 | 0.27 | 0.23 | 0.32 | 0.53 | 0.44 | 0.64 | 64.39 | 1.31 | 0.33 | 0.27 | 0.40 | 0.62 | 0.49 | 0.78 |
| 75,000-99,999 | 49.10 | 1.22 | 0.32 | 0.27 | 0.38 | 0.52 | 0.43 | 0.62 | 69.85 | 1.23 | 0.42 | 0.35 | 0.52 | 0.73 | 0.58 | 0.92 |
| 100,000-149,999 | 58.78 | 1.07 | 0.47 | 0.41 | 0.55 | 0.66 | 0.56 | 0.77 | 72.88 | 1.05 | 0.49 | 0.40 | 0.60 | 0.72 | 0.58 | 0.90 |
| 150,000-199,999 | 67.32 | 1.54 | 0.68 | 0.57 | 0.83 | 0.76 | 0.64 | 0.91 | 79.89 | 1.22 | 0.73 | 0.58 | 0.91 | 0.76 | 0.59 | 0.98 |
| ≥200,000 | 75.08 | 1.23 | 1.00 | reference | 1.00 | reference | 84.53 | 1.11 | 1.00 | reference | 1.00 | reference | ||||
| Unknown | 41.38 | 0.98 | 0.23 | 0.20 | 0.27 | 0.52 | 0.40 | 0.68 | 61.50 | 0.95 | 0.29 | 0.24 | 0.35 | 0.72 | 0.54 | 0.95 |
| Housing tenure | ||||||||||||||||
| Owner | 53.82 | 0.58 | 1.00 | reference | 1.00 | reference | 71.18 | 0.52 | 1.00 | reference | 1.00 | reference | ||||
| Renter | 43.02 | 0.95 | 0.65 | 0.59 | 0.71 | 0.97 | 0.86 | 1.10 | 62.06 | 1.00 | 0.66 | 0.60 | 0.73 | 0.84 | 0.73 | 0.96 |
| Parental employment status | ||||||||||||||||
| Employed | 51.21 | 0.53 | 1.00 | reference | 1.00 | reference | 68.77 | 0.51 | 1.00 | reference | 1.00 | reference | ||||
| Not employed | 43.40 | 0.89 | 0.73 | 0.67 | 0.79 | 1.00 | 0.90 | 1.12 | 63.69 | 0.84 | 0.80 | 0.73 | 0.87 | 1.05 | 0.93 | 1.19 |
| Recent household job loss | ||||||||||||||||
| Yes | 41.92 | 1.16 | 0.72 | 0.65 | 0.79 | 0.95 | 0.83 | 1.08 | 63.87 | 1.07 | 0.84 | 0.76 | 0.93 | 1.05 | 0.91 | 1.21 |
| No | 50.19 | 0.50 | 1.00 | reference | 1.00 | reference | 67.77 | 0.48 | 1.00 | reference | 1.00 | reference | ||||
| Parental health insurance status | ||||||||||||||||
| Insured | 51.21 | 0.51 | 1.00 | reference | 1.00 | reference | 69.14 | 0.47 | 1.00 | reference | 1.00 | reference | ||||
| Not insured | 35.90 | 1.88 | 0.53 | 0.45 | 0.63 | 0.73 | 0.59 | 0.90 | 54.91 | 2.03 | 0.54 | 0.46 | 0.64 | 0.75 | 0.60 | 0.95 |
| Parental COVID-19 diagnosis | ||||||||||||||||
| Yes | 40.52 | 0.77 | 0.62 | 0.57 | 0.67 | 0.73 | 0.66 | 0.80 | 59.83 | 0.76 | 0.63 | 0.59 | 0.69 | 0.76 | 0.69 | 0.85 |
| No | 52.33 | 0.57 | 1.00 | reference | 1.00 | reference | 70.13 | 0.54 | 1.00 | reference | 1.00 | reference | ||||
| Parental COVID-19 vaccination status | ||||||||||||||||
| Vaccinated | 60.46 | 0.51 | 1.00 | reference | 1.00 | reference | 80.71 | 0.42 | 1.00 | reference | 1.00 | reference | ||||
| Not vaccinated | 6.32 | 0.60 | 0.04 | 0.04 | 0.05 | 0.06 | 0.05 | 0.07 | 11.32 | 0.69 | 0.03 | 0.03 | 0.04 | 0.04 | 0.03 | 0.04 |
SE= standard error. OR=odds ratio; CI=confidence interval. 1ORs estimated by logistic model were unadjusted for the effects of other covariates. 2Adjusted by logistic regression model for parental age, gender, race/ethnicity, marital status, region of residence, education, household income, housing tenure, recent household job loss, employment status, insurance status, COVID-19 diagnosis, and COVID-19 vaccination status. 3Consists of American Indians and Alaska Natives, Native Hawaiians and Pacific Islanders, and mixed-race individuals. Chi-square statistics for testing the overall association between each covariate and observed/unadjusted COVID-19 vaccine rates for children aged 5-11 and for adolescents aged 12-17 were statistically significant at p<0.01.
2.3. Statistical Methods
Multivariate logistic regression was used to model vaccination disparities among children after controlling for parental or household socioeconomic, demographic, and health characteristics. The Chi-square statistic was used to test the overall association between each covariate and vaccination prevalence, whereas the two-sample t-test was used to test the difference in prevalence between any two groups or geographic areas. To account for the complex sample design of the HPS, SUDAAN software was used to conduct all statistical analyses, including the logistic modeling procedure RLOGIST.22
3. Results
3.1. Disparities in COVID-19 Vaccination among US Children Aged 5-17 by Social Determinants
During December 2021–April 2022, an estimated 40.1 million, or 57.2% of US children aged 5-17 years received COVID-19 vaccination (Table 1). The child vaccination rate varied 2-fold across the parental age range, from a low of 34.9% for parents aged 25-34 to 69.2% for parents aged 45-54 years (Table 1). Adjusted for covariates, children of parents aged 18-24 and 45-54 had, respectively, 115% and 69% higher odds of vaccination, and children of parents aged 25-34 had 45% lower odds, compared with children of parents aged ≥75 (Table 1).
Female adults, non-Hispanic Blacks, other and multiple-race adults, divorced/separated, widowed, and single individuals, adults with lower education and household income levels, renters, not-employed or uninsured individuals, adults with prior COVID-19 diagnoses, and adults without COVID-19 vaccination reported significantly lower rates of vaccination for their children aged 5-17 (Table 1). Controlling for sociodemographic and health characteristics, Asian and Hispanic children had, respectively, 134% and 47% higher odds of receiving vaccination than their non-Hispanic White counterparts (Table 1). Compared with children of parents with at least a master’s degree, children of parents with a high school education, some college, or bachelor’s degree had, respectively, 47%, 39%, and 23% lower adjusted odds of receiving a vaccination (Table 1). Children with household income <$25,000 had 48% lower adjusted odds of receiving vaccination than those with household income ≥$200,000 (Table 1). Children of uninsured parents had 25% lower adjusted odds of receiving vaccination than children whose parents had health insurance.
Parental COVID-19 diagnosis and parental vaccination status were strong predictors of children’s vaccination status (Table 1). Controlling for covariates, children of parents who had a prior COVID-19 diagnosis had 27% lower odds of vaccination than children of parents without a COVID-19 diagnosis. Children whose parents had not received COVID-19 vaccination themselves had 95% lower odds of receiving COVID-19 vaccination than children whose parents received COVID-19 vaccination, controlling for other factors.
3.2. Disparities in COVID-19 Vaccination among US Children Aged 5-11 and Adolescents Aged 12-17
During December 2021–April 2022, an estimated 19.9 million or 47.7% of US children aged 5-11 received COVID-19 vaccination (Table 2). During the same period, 29.1 million, or 66.1% of US adolescents aged 12-17 received COVID-19 vaccination (Table 2). Parents aged 45-54 reported the highest vaccination rates for their children aged 5-11 (58.5%) and adolescents aged 12-17 (75.1%), whereas parents aged 25-34 reported the lowest vaccination rate for their children aged 5-11 (29.9%) and adolescents aged 12-17 (50.6%).
About 77.3% of Asian children aged 5-11 had received COVID-19 vaccination, compared with 40.5% of Black children, 45.2% of non-Hispanic White children, and 49.5% of Hispanic children aged 5-11. About 91.9% of Asian adolescents aged 12-17 had received COVID-19 vaccination, compared with 63.2% of Black adolescents and 62.6% of non-Hispanic White adolescents, and 70.3% of Hispanic adolescents (Table 2). Controlling for covariates, Asian children aged 5-11 had 142% higher odds of vaccination, and Asian adolescents aged 12-17 had 287% higher odds of vaccination compared with their non-Hispanic White counterparts. Hispanic children aged 5-11 had 45% higher adjusted odds of vaccination and Hispanic adolescents aged 12-17 had 54% higher adjusted odds of vaccination than their non-Hispanic White counterparts.
Marked education and income gradients in vaccination rates were found for children aged 5-11 and adolescents 12-17. Compared with children aged 5-11 whose parents had at least a master’s degree, children aged 5-11 whose parents had a high school education, some college, or bachelor’s degree had, respectively, 48%, 44%, and 30% lower adjusted odds of receiving a vaccination. Compared with adolescents aged 12-17 whose parents had at least a master’s degree, adolescents aged 12-17 whose parents had a high school education, some college, or bachelor’s degree had, respectively, 52%, 43%, and 19% lower adjusted odds of receiving a vaccination.
3.3. Disparities in Childhood COVID-19 Vaccination among 15 Largest US Metropolitan Areas
Rates of COVID-19 vaccination among children aged 5-17 ranged from a low of 49.6% in Atlanta MSA, Georgia, and 52.1% in Detroit MSA, Michigan to a high 82.6% in San Francisco-Oakland MSA, California (Figure 1). Parental age, race/ethnicity, education, household income, and prior parental COVID-19 diagnosis and vaccination status were independent and significant predictors of COVID-19 vaccination in metropolitan areas (data not shown). After controlling for covariates, the odds of vaccination for all MSAs, except for Boston MSA, Massachusetts, were significantly lower than those for San Francisco-Oakland MSA. For example, compared with San Francisco-Oakland MSA, the adjusted odds of receiving COVID-19 vaccination among children aged 5-17 were 68% lower (OR=0.32; 95% CI=0.23-0.45) in Atlanta MSA, 58% lower (OR=0.42; 95% CI=0.30-0.59) in Detroit MSA, and 34% lower (OR=0.66; 95% CI=0.49-0.90) in Washington, DC metropolitan area (Figure 1).

- Prevalence1 and Adjusted2 Odds Ratios for COVID-19 vaccination among children aged 5-17 years in 15 largest Metropolitan Statistical Areas (MSAs), United States, December 2021 - April 2022 (N=28,156). 1Prevalence rates of childhood COVID-19 vaccination for all MSAs were significantly lower than the rate for San Franciso-Oakland MSA at p<0.01. 2Adjusted by logistic regression for age, gender, race/ethnicity, marital status, education, household income, recent household job loss, employment status, insurance status, and COVID-19 diagnosis, and COVID-19 vaccination status. The adjusted odds ratio for Boston MSA was not statistically significant at p<0.01. All other MSAs had significantly lower odds ratios, indicating lower adjusted vaccination prevalence compared with San Francisco-Oakland MSA. Source: Data derived from December 2021 – April 2022 Household Pulse Survey
Rates of COVID-19 vaccination among children aged 5-11 ranged from a low of 40.4% in Detroit MSA, Michigan, and 40.8% in Riverside-San Bernardino MSA, California to a high 77.7% in San Francisco-Oakland MSA, California. Rates of COVID-19 vaccination among adolescents aged 12-17 ranged from a low of 57.9% in Atlanta MSA, Georgia, and 62.7% in Dallas-Fort Worth MSA, Texas to a high 87.7% in San Francisco-Oakland MSA, California (Figure 2).
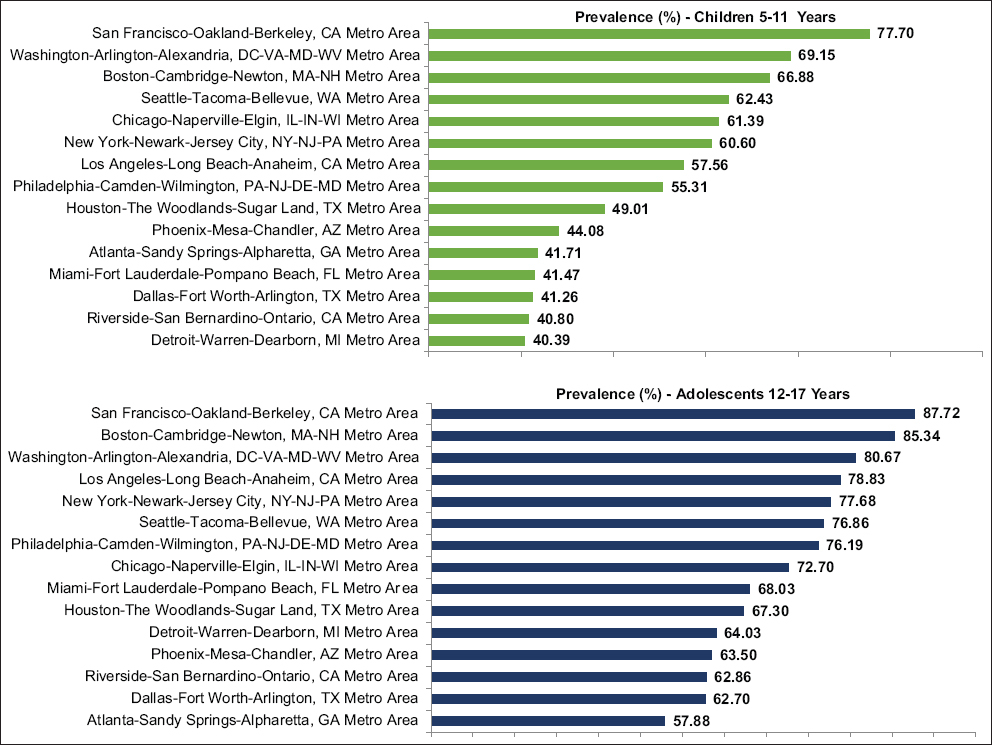
- Unadjusted prevalence of COVID-19 vaccination among children aged 5-11 years and adolescents aged 12-17 years in 15 largest Metropolitan Statistical Areas, United States, December 2021 - April 2022. Prevalence rates of COVID-19 vaccination among children aged 5-11 years for all MSAs were significantly lower than the rate for San Francisco-Oakland MSA at p<0.01. Prevalence rates of COVID-19 vaccination among adolescents aged 12-17 years for all MSAs were significantly lower than the rate for San Francisco-Oakland MSA at p<0.05 except for Boston (p=0.41). Source: Data derived from December 2021-April 2022 Household Pulse Survey
4. Discussion
In this study, using the recent national data, we have analyzed disparities in COVID-19 vaccination rates among US children and adolescents, showing wide variations among various racial/ethnic and socioeconomic groups and geographic areas. We found markedly lower rates of childhood vaccination among Black, Hispanic, and non-Hispanic White children (compared with Asian American children), those with lower parental education and household income levels, those with parents without health insurance, those with parents having a prior COVID-19 diagnosis, and children of parents without COVID-19 vaccination. Some of these groups are also groups that are in urgent need of vaccination, given that they are at substantially higher risks of COVID-19 infections, hospitalization, mortality, and school absence.9,23,24 Equitable vaccination coverage is, however, critical to ensuring reductions in COVID-19 health inequities among racial/ethnic minorities and socially-disadvantaged populations.6,9,23 The Census Bureau’s analysis of HPS data indicates that, for children aged 5-11, the majority of parents expressed concerns about safety and side effects, lack of belief in necessity or distrust of a COVID-19 vaccine, no doctor’s recommendation, or unavailability of vaccines.25 For children aged 12-17, the most prominent reason given for children not receiving or planning to receive vaccine was parental concerns about possible side effects for children, followed by not trusting the COVID-19 vaccines, mistrust of the government, and the belief that children do not need a vaccine.25 In order to promote children’s vaccination efforts, further studies are needed to examine the extent to which reasons for vaccine hesitancy or not intending to have children vaccinated differ by race/ethnicity, household socioeconomic status, geographic area, and health characteristics.
Our study findings on racial/ethnic disparities in COVID-19 vaccination are consistent with those reported in other recent studies, however, unlike our study, we did not examine whether racial/ethnic disparities persist after controlling for individual socioeconomic and demographic characteristics.9,16,17 Racial/ethnic disparities in COVID-19 vaccination shown here are consistent with similar disparities in flu vaccine uptake among children during the 2019-2020 season showing significantly lower rates of flu vaccination among Hispanics, Blacks, and American Indians/Alaska Natives compared to Asians and non-Hispanic Whites.9,26,27 Socioeconomic and healthcare access factors in COVID-19 vaccination are also consistent with those in flu and other childhood vaccinations that show lower immunization rates among uninsured children and among children in low-income households.26,27
Although disparities in COVID-19 vaccination rates among racial/ethnic and socioeconomic groups and socially-vulnerable communities have been previously reported for the adult population,9,16,17 our study, to the best of our knowledge, is one of the first to have simultaneously examined child vaccine inequalities by a wide range of sociodemographic and health factors during the ongoing pandemic. Additionally, our study makes a unique contribution to COVID-19 research by identifying racial/ethnic and socioeconomic disparities in COVID-19 vaccination both at the national level and in the 15 largest metropolitan areas of the US. The recent FDA authorization and the CDC recommendation of COVID-19 vaccines for children 6 months through 5 years of age offer the opportunity to collect additional data and examine vaccine disparities among all children under 18 years of age.28,29
4.1. Limitations
This study has some limitations. First, racial/ethnic detail in the HPS public use file is limited as we are unable to identify American Indians and Alaska Natives and specific Asian/Pacific Islander and Hispanic subgroups as well as immigrant children and non-English speakers who may have lower rates of COVID-19 vaccination.18 These groups are not identified in the public-use HPS file because of the small sample size and confidentiality reasons.18 Second, the HPS lacks data for several other priority groups such as children living in rural areas, those experiencing homelessness, or those with special healthcare needs such as developmental disabilities, all of whom may have a higher likelihood of not getting vaccinated and who may therefore be at substantially increased risk for severe illness from COVID-19.9,23 Indeed, data on child characteristics other than child’s age, such as child’s gender, COVID-19 diagnosis status, or physical, mental or behavioral health status are not available in HPS. Third, the respondents in HSP are more likely to be women and non-Hispanic Whites and have higher education, compared with the American Community Survey.30 This might have resulted in an underestimate of the magnitude of racial/ethnic and socioeconomic disparities in childhood vaccine coverage. However, we addressed disproportionate sampling of demographic characteristics by using survey weights, which rake the demographics of the interviewed persons to education attainment/sex/age distributions and ethnicity/race/sex/age population distributions.19
5. Conclusion and Global Health Implications
Based on the analysis of the recent census data on 86,335 US children aged 5-17 years, this study has found large disparities in COVID-19 vaccination rates by parental race/ethnicity, SES, health care access, COVID-19 diagnosis, parental vaccination status, and metropolitan area. During December 2021-April 2022, 40.1 million or 57.2% of US children aged 5-17 received COVID-19 vaccination. Blacks, Hispanics, socioeconomically-disadvantaged children, children of uninsured parents, children of parents without COVID-19 vaccination or with COVID-19 diagnoses, and children living in Atlanta, Georgia; Detroit, Michigan; Riverside-San Bernardino, California; and Dulles-Fort Worth, Texas metropolitan areas had a substantially lower likelihood of receiving a vaccination.
Equitable vaccination coverage is critical to reducing inequities in COVID-19 health outcomes among children both in the US and globally. Given the large vaccine disparities by racial/ethnic, socioeconomic, and geographic factors, additional outreach and educational campaigns are needed to reach populations that continue to experience increased risks of infections, hospitalization, mortality, and adverse child outcomes associated with COVID-19.
Acknowledgments:
None.
Compliance with Ethical Standards
Conflicts of Interest: The authors declare that they have no conflict of interest.
Financial Disclosure: None to report.
Funding/Support: None.
Ethical approval: No IRB approval was required for this study, which is based on the secondary analysis of a public-use federal database.
Disclaimer: The views expressed are the authors’ and not necessarily those of their institutions.
References
- Impact of COVID-19 on People's Livelihoods, Their Health and Our Food Systems WHO. https: //www.who.int/news/item/13-10-2020-impact-of-covid-19-on-people's-livelihoods-their-health-and-our-food-systems
- Coronavirus Disease (COVID-19) Pandemic WHO. https: //www.who.int/emergencies/diseases/novel-coronavirus-2019
- The Impact of the COVID-19 Pandemic on Jobs and Incomes in G20 Economies G20 Saudi Arabia 2020. ILO-OECD. https: //www.ilo.org/wcmsp5/groups/public/---dgreports/---cabinet/documents/publication/wcms_756331.pdf
- Provisional life expectancy estimates for January through June, 2020 National Center for Health Statistics (U. S.). Division of Vital Statistics. NVSS Vital Statistics Rapid Release:Report. 010 Published February 2021 https: //stacks.cdc.gov/view/cdc/100392
- [Google Scholar]
- Growing job-related income losses, increasing social inequalities, and physical and mental health impact during the COVID-19 pandemic, United States, April–December 2020. Int J Transl Med Res Public Health. 2021;5(2):76-89. 10.21106/ijtmrph.347
- [Google Scholar]
- Marked inequalities in COVID-19 vaccination by racial/ethnic, socioeconomic, geographic, and health characteristics, United States, January 6 –February 15, 2021. Int J Transl Med Res Public Health. 2021;5(2):103-112. 10.21106/ijtmrph.357
- [Google Scholar]
- Years of life lost to COVID-19 in 81 countries. Sci Rep. 2021;11(1):3504. 10.1038/s41598-021-83040-3
- [Google Scholar]
- Johns Hopkins University &Medicine Coronavirus Resource Center. https: //coronavirus.jhu.edu/region/united-states
- COVID Data Tracker:Pediatric Data. COVID CDC. https: //covid.cdc.gov/covid-data-tracker/#pediatric-data
- 2021. CDC Director Statement on Pfizer's Use of COVID-19 Vaccine in Adolescents Age 12 and Older CDC Newsroom. Published May 12 https: //www.cdc.gov/media/releases/2021/s0512-advisory-committee-signing.html
- CDC Recommends Pediatric COVID-19 Vaccine for Children 5 to 11 Years CDC Newsroom. Published November 2, 2021 https: //www.cdc.gov/media/releases/2021/s1102-PediatricCOVID-19Vaccine.html#:~:text=CDC
- Voluntary COVID-19 vaccination of children:a social responsibility. J Med Ethics. 2021;47(8):543-546. 10.1136/medethics-2021-107370
- [Google Scholar]
- COVID-19 vaccines for children. Science. 2021;374(6570):913. 10.1126/science.abn2566
- [Google Scholar]
- Parents'intentions and perceptions about COVID-19 vaccination for their children:Results from a national survey. Pediatrics. 2021;148(4):e2021052335. 10.1542/peds.2021-052335
- [Google Scholar]
- Canadian parents'perceptions of COVID-19 vaccination and intention to vaccinate their children:Results from a cross-sectional national survey. Vaccine. 2021;39(52):7669-7676. 10.1016/j.vaccine.2021.10.002
- [Google Scholar]
- Latest data on COVID-19 vaccinations by race/ethnicity. Kaiser Family Foundation (KFF). Published July 14, 2022 https: //www.kff.org/coronavirus-covid-19/issue-brief/latest-data-on-covid-19-vaccinations-by-race-ethnicity
- [Google Scholar]
- Racial disparities in COVID-19 impacts and vaccinations for children. Kaiser Family Foundation (KFF). Published September 16, 2021 https: //www.kff.org/racial-equity-and-health-policy/issue-brief/racial-disparities-in-covid-19-impacts-and-vaccinations-for-children/#:~:text=While%20data%20remain%20limited%2C%20available,observed%20among%20the%20broader%20population
- [Google Scholar]
- Household Pulse Survey Data Dictionary for SAS - Phase 3.3 and Phase 3.4, Weeks 40 to 44, December 2021-April 2022 Census.gov. https: //www.census.gov/programs-surveys/household-pulse-survey/datasets.html
- Design and Operation of the 2020 Household Pulse SurveyUS Census Bureau;2020. Forthcoming. https: //www2.census.gov/programs-surveys/demo/technical-documentation/hhp/2020_HPS_Background.pdf
- [Google Scholar]
- 2022. Technical Documentation:Source of the Data and Accuracy of the Estimates for the Household Pulse Survey –Phase 3.4. https: //www2.census.gov/programs-surveys/demo/technical-documentation/hhp/Phase3-4_Source_and_Accuracy_Week44.pdf
- Social determinants of health in the United States:addressing major health inequality trends for the nation, 1935-2016. Int J MCH AIDS. 2017;6(2):139-164. 10.21106/ijma.236
- [Google Scholar]
- Release 11.0.3 Research Triangle Park. NC: Research Triangle Institute; 2018.
- COVID-19:Risk for COVID-19 Infection, Hospitalization, and Death by Race/Ethnicity CDC. Updated June 24, 2022 https: //www.cdc.gov/coronavirus/2019-ncov/covid-data/investigations-discovery/hospitalization-death-by-race-ethnicity.html
- COVID-19 trends among persons aged 0–24 Years —United States, March 1–December 12, 2020 13 January 2021. MMWR Morb Mortal Wkly Rep. 2021;70(3):88-94. 10.15585/mmwr.mm7003e1
- [Google Scholar]
- Week 44 Household Pulse Survey:March 30 –April 11. Census.gov. Published April 20, 2022 https: //www.census.gov/data/tables/2022/demo/hhp/hhp44.html
- Influenza (Flu):Health Equity and Flu CDC. https: //www.cdc.gov/flu/highrisk/disparities-racial-ethnic-minority-groups.html
- Vaccines &Immunizations: Equity in Childhood COVID-19 Vaccination CDC. https: //www.cdc.gov/vaccines/covid-19/planning/children/equity.html#:~:text=Barriers%20to%20Equity%20in%20Childhood%20COVID%2D19%20Vaccination,-Children%20at%20a&text=Some%20children%20are%20at%20greater,who%20live%20in%20rural%20areas
- FDA News Release:Coronavirus (COVID-19) Update:FDA Authorizes Moderna and Pfizer-BioNTech COVID-19 Vaccines for Children Down to 6 Months of Age. FDA.gov. Published June 17, 2022 https: //www.fda.gov/news-events/press-announcements/coronavirus-covid-19-update-fda-authorizes-moderna-and-pfizer-biontech-covid-19-vaccines-children
- CDC Recommends COVID-19 Vaccines for Young Children. CDC Newsroom. Published June 18, 2022 https: //www.cdc.gov/media/releases/2022/s0618-children-vaccine.html#:~:text=Parents%20and%20caregivers%20can%20now,%2D19%2C%20should%20get%20vaccinated
- How do state policies shape experiences of household income shocks and mental health during the COVID-19 pandemic? Soc Sci Med. 2021;269:113557. 10.1016/j.socscimed.2020.113557
- [Google Scholar]