Translate this page into:
Contributions of Socioeconomic, Demographic, and Behavioral Risk Factors to All-Cause Mortality Disparities by Psychological Distress in the United States: A Blinder-Oaxaca Decomposition Analysis of Longitudinal Data
*Corresponding author email: hyunjung.lee0001@gmail.com
-
Received: ,
Accepted: ,
This is an open-access article distributed under the terms of the Creative Commons Attribution-Noncommercial-Share Alike 4.0 Unported, which permits unrestricted use, distribution, and reproduction in any medium, provided the original work is properly cited.
Abstract
Background:
Previous research has shown a significant association between psychological distress (PD) and all-cause mortality. However, there is a dearth of studies quantifying the contributions of sociodemographic and behavioral characteristics to group differences in mortality. In this study, we identify factors of mortality differences by PD.
Methods:
The Blinder-Oaxaca decomposition analysis was used to quantify the contributions of individual sociodemographic and behavioral characteristics to the observed mortality differences between United States (US) adults with no PD and those with serious psychological distress (SPD), using the pooled data from the 1997-2014 National Health Interview Survey prospectively linked to the 1997-2015 National Death Index (N = 263,825).
Results:
Low educational level, low household income, and high proportions of current smokers, renters, former drinkers, and adults experiencing marital dissolution contributed to high all-cause mortality among adults with SPD. The relative percentage of all-cause mortality disparity explained by socioeconomic and demographic factors was 38.86%. Approximately 47% of the mortality disparity was attributed to both sociodemographic and behavioral risk factors. Lower educational level (21.13%) was the top contributor to higher all-cause mortality among adults with SPD, followed by smoking status (13.51%), poverty status (11.77%), housing tenure (5.11%), alcohol consumption (4.82%), marital status (3.61%), and nativity/immigrant status (1.95%). Age, sex, and body mass index alleviated all-cause mortality risk among adults with SPD.
Conclusions and Global Health Implications:
Improved education and higher income levels, and reduced smoking among US adults with SPD might eliminate around half of the all-cause mortality disparity by SPD. Such a policy strategy might lead to reductions in mental health disparities and adverse health impacts both in the US and globally.
Keywords
Psychological Distress
Socioeconomic Status
Health Behaviors
All-Cause Mortality
Blinder-Oaxaca Decomposition
Longitudinal

1. Introduction
In 2019, approximately 4.7% of adults aged 18 years and older in the United States had experienced depression and 11.2% of adults had felt worry, nervousness, or anxiety.1 The prevalence of serious psychological distress (SPD) including various symptoms of mental illness showed a fairly stable but increasing trend, ranging from 2.9% in 1997 to 4.2% in 2018.2,3 The prevalence of poor mental health was associated with higher mental health spending and lower life expectancy.4,5 United States mental health market spending was $225 billion in 2019, which increased by 52.1% since 2009.6 Life expectancy is 10.58 years shorter for adults with SPD, measured by the Kessler 6 (K6) nonspecific distress scale7 equaling 13 or more at age 18, compared with life expectancy for adults with no psychological distress, measured by K6 equaling zero.5
Psychological distress (PD) is a general term incorporating symptoms of anxiety, depression, and other symptoms of distress.8 Although, the association between PD and mortality8-17 has long been established, little is known about the effect of PD on mortality in conjunction with sociodemographic and behavioral factors. From previous studies, the risk factors for psychological distress include age, sex, race/ethnicity, nativity/immigrant status, education, marital status, poverty status, housing tenure, region of residence, body mass index (BMI), smoking status, and alcohol consumption.8,9,12,18–25 Low socioeconomic status (SES) can increase the chances of stressful experiences such as job loss, illness, or disabilities, and is associated with fewer financial or community resources to manage stress, resulting in an increase in negative emotions such as depression or anxiety.26,27 These negative emotions directly increase mortality or indirectly increase mortality through risky health behavioral pathways such as smoking, alcohol consumption, or poor diet.19,26 A recent study found that socioeconomic and demographic characteristics explained a 13% reduction in relative risk of all-cause mortality related to SPD, and sociodemographic and behavioral-health factors jointly accounted for a 22% reduction in the mortality risk related to SPD.5
Previous research has shown a significant association between SPD and mortality or socioeconomic characteristics, but there is a dearth of studies quantifying the contributions of sociodemographic and behavioral characteristics to the mortality difference. In this study, we conducted the Blinder-Oaxaca decomposition analysis to quantify the contributions of individual characteristics in explaining the observed all-cause mortality differences between adults with no PD and adults with SPD, enabling us to identify main contributors to reducing disparities in mortality.
2. Methods
2.1. Data
The data for this study were from the 1997-2014 National Health Interview Survey (NHIS) prospectively linked to the 1997-2015 National Death Index (NDI).28 As a nationally representative, annual cross-sectional household interview survey, NHIS provides demographic, socioeconomic, and health characteristics of the civilian, non-institutionalized population in the United States. The National Center for Health Statistics (NCHS) developed public-use versions of NHIS prospectively linked with death certificate records from the NDI. For this study, we used the latest available 1997-2015 public-use linked mortality file containing 19 years of mortality follow-up data from the date of survey participation through December 31, 2015.29
2.2. Sample
The study sample consisted of adults aged 18 and older from 1997 to 2014 NHIS sample adult files. Since the main decomposition analysis allows only dichotomous group variable, we restricted the study sample to adults with no PD (K6=0) and adults with SPD (K6=13+) as defined below. The final pooled eligible sample size after excluding missing values was 263,825; the listwise deletion accounted for 1.61% of the total sample size of 268,145. For missing values (accounting for more than 1% of the total observations), for poverty status (18.74%), body mass index (BMI) (3.54%), and alcohol consumption (1.66%), we created missing categories so as to not lose a substantial number of observations for the analysis.
2.3. Outcome Measurement (Dependent Variable)
We analyzed crude death rates for all-causes combined. The mortality outcome was dichotomized, with 1 being dead and 0 equaling alive.
2.4. Psychological Distress Classification
Psychological distress (PD) was measured by the Kessler 6 (K6) nonspecific distress scale7 of six symptoms. Respondents were asked: “during the past 30 days, how often did you feel, 1) so sad that nothing could cheer you up, 2) nervous, 3) restless or fidgety, 4) hopeless, 5) that everything was an effort, and 6) worthless.” We created a 5-level categorical variable with scores of 0, 1-2, 3-5, 6-12, and 13-24 from the K6 scale.8 Since the Blinder-Oaxaca technique allows only a dichotomous group comparison, we only used individuals with no PD (K=0) as a reference group and individuals with SPD (K=13+) as another group. We did sensitivity analysis by changing the reference group from adults with no PD (K6=0) to adults with no SPD (K6=0-12).
2.5. Contributors (Independent Variables)
Based on the previous literature, we selected the following contributors for model estimation: 1) sociodemographic characteristics including age, sex, race/ethnicity, nativity/immigrant status, education, marital status, poverty status, housing tenure, and region of residence, and 2) behavioral characteristics including BMI, smoking status, and alcohol consumption.5,8,9,12,19–21
2.6. Analytic Approach
The Blinder-Oaxaca decomposition analysis was conducted to quantify the contributions of individual characteristics in explaining the observed mortality differences between adults with no PD and those with SPD.30,31 While regression analysis reveals the association between mortality and its risk factors, the decomposition analysis allows to estimate the association between the mortality disparities and their contributing causes or risk factors, possibly identifying factors for reducing health inequalities.31

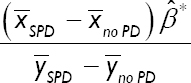
In the given equation, Y̅ SPD and Y̅ no PD no represent means of the rates of deaths for adults with SPD and those with no PD, and X̅ SPD and X̅ no PD are vectors of group-specific means of the individual-level characteristics studied. β̂ * is the vector of coefficients from the pooled linear probability models that reflects the average outcome difference associated with each variable. β̂ SPD is the adjusted difference in outcomes between adults with no PD and those with SPD that remains unexplained by covariates. The “explained” portion of the decomposition reflects the change in the mean of mortality rates for adults with SPD, compared to those with no PD, due to the differences in the individual-level characteristics. The percentage of the outcome difference explained by each covariate can be calculated by dividing the explained difference by the total difference:
We estimated two models of Blinder-Oaxaca decomposition analysis: model 1 included only socio-demographic characteristics; model 2 included both socio-demographic and health behavioral characteristics as contributors.
Collinearity between model covariates was assessed using variance inflation factors, and all values across models were within an acceptable range (≤1.61). Complex survey design procedures, svy in Stata, were used, to account for clustering, multiple stages of selection, and disproportionate sampling.32 To correct the bias from the ineligible adults for linkage to the NDI due to insufficient identifying data, we used eligibility-adjusted weights developed by NCHS, instead of the standard sample weight.33 The sample weights were adjusted by dividing by the number of pooling years. All the analyses were conducted by Stata 17 and the Blinder-Oaxaca model was fitted using the Oaxaca procedure.32
3. Results
3.1. Mortality and Individual Characteristics by No Psychological Distress and Serious Psychological Distress
Overall, there was a significant difference in weighted unadjusted death rates between adults with no PD and those with SPD (Table 1). Adults with SPD had higher all-cause mortality, compared to those with no PD. Differences between adults with no PD and those with SPD were observed in individual characteristics including socio-demographic characteristics and health behaviors, known to typically affect health and mortality (Table 1). Adults with SPD were more likely to be female, non-Hispanic Blacks, Hispanics, American Indians/Alaska Natives, or non-Hispanic others, US-born, with less than high school education, not currently married, below poverty level, renters, Midwest or South residents, with higher BMI, current smokers, and former drinkers (P<0.001).
| Sample size | No psychological distress (K6=0) | Serious psychological distress (K6=13+) | p-value |
|---|---|---|---|
| 245,153 | 18,263 | ||
| All-cause mortality | 9.78 (0.09) | 16.02 (0.34) | <0.001 |
| Age (mean, years) | 46.54 (0.08) | 46.22 (0.15) | <0.001 |
| Sex | |||
| Male | 52.74 (0.13) | 38.18 (0.47) | <0.001 |
| Female | 47.26 (0.13) | 61.82 (0.47) | |
| Race/ethnicity | |||
| Non-Hispanic White | 68.42 (0.25) | 68.41 (0.53) | <0.001 |
| Non-Hispanic Black | 12.18 (0.19) | 13.12 (0.37) | |
| Hispanic | 13.86 (0.19) | 14.62 (0.36) | |
| American Indians/Alaska Native | 0.57 (0.05) | 1.33 (0.13) | |
| Asian/Pacific Islander | 4.72 (0.09) | 2.20 (0.14) | |
| Non-Hispanic other race | 0.26 (0.02) | 0.33 (0.05) | |
| Nativity/Immigrant status | |||
| Foreign-born | 17.38 (0.18) | 13.44 (0.32) | <0.001 |
| US-born | 82.62 (0.18) | 86.56 (0.32) | |
| Education | |||
| Less than high school | 12.96 (0.13) | 28.87 (0.45) | <0.001 |
| High school | 31.42 (0.16) | 35.03 (0.47) | |
| Some college | 28.40 (0.14) | 26.99 (0.44) | |
| College | 27.22 (0.21) | 9.12 (0.28) | |
| Marital status | |||
| Currently married | 60.73 (0.18) | 41.58 (0.54) | <0.001 |
| Widowed | 6.01 (0.06) | 8.44 (0.23) | |
| Divorced/separated | 11.24 (0.08) | 25.36 (0.41) | |
| Never married | 22.02 (0.16) | 24.62 (0.43) | |
| Poverty status (%) | |||
| <100 | 8.10 (0.11) | 28.13 (0.47) | <0.001 |
| >=100&<200 | 13.23 (0.12) | 24.35 (0.40) | |
| >=200&<400 | 25.35 (0.14) | 21.65 (0.39) | |
| >=400 | 34.49 (0.22) | 12.91 (0.38) | |
| Missing | 18.84 (0.18) | 12.96 (0.34) | |
| Housing tenure (home ownership) | |||
| Renter | 27.87 (0.25) | 47.25 (0.56) | <0.001 |
| Owner | 72.13 (0.25) | 52.75 (0.56) | |
| Region of residence | |||
| Northeast | 18.46 (0.20) | 15.93 (0.40) | <0.001 |
| Midwest | 22.00 (0.27) | 22.72 (0.59) | |
| South | 39.21 (0.33) | 40.75 (0.68) | |
| West | 20.33 (0.25) | 20.60 (0.48) | |
| Body mass index (BMI) | |||
| <25 | 38.48 (0.14) | 33.44 (0.45) | <0.001 |
| =>25 & <30 | 35.76 (0.12) | 28.29 (0.43) | |
| =>30 & <40 | 20.08 (0.11) | 27.64 (0.41) | |
| =>40 | 2.58 (0.04) | 7.79 (0.27) | |
| Missing | 3.10 (0.05) | 2.84 (0.14) | |
| Smoking status | |||
| Never smoker | 60.80 (0.16) | 37.78 (0.49) | <0.001 |
| Former smoker | 21.86 (0.12) | 20.01 (0.37) | |
| Current smoker | 17.34 (0.12) | 42.22 (0.47) | |
| Alcohol consumption | |||
| Lifetime abstainer | 25.27 (0.19) | 21.56 (0.44) | <0.001 |
| Former drinker | 13.35 (0.11) | 24.35 (0.41) | |
| Current drinker | 60.20 (0.20) | 53.02 (0.52) | |
| Unknown | 1.19 (0.03) | 1.06 (0.11) | |
The data in the parentheses indicate standard errors.
3.2. Blinder-Oaxaca Decomposition
Blinder-Oaxaca decomposition analysis results (Table 2) showed that 38.86% of the difference in all-cause mortality between adults with no PD and those with SPD (-6.23 percentage points, 95% CI = -6.92, -5.54) was explained by the sum total of the sociodemographic characteristics (Model 1). Similarly, 46.86% of the difference in all-cause mortality between adults with no PD and those with SPD was explained by socio-demographic characteristics and health behaviors combined (Model 2).
| Model 1 | Model 2 | |||||
|---|---|---|---|---|---|---|
| Percentage points (CI) | Relative percentage (%) | Percentage points (CI) | Relative percentage (%) | |||
| Total difference between No PD (K6=0) and SPD (K6=13+) |
-6.23 (-6.92,-5.54) | 100 | -6.23 (-6.92,-5.54) | 100 | ||
| Component explained by measured variables | -2.42 (-2.69,-2.15) | 38.86 | -2.92 (-3.21,-2.63) | 46.86 | ||
| Component unexplained by measured variables | -3.81 (-4.45,-3.17) | 61.14 | -3.31 (-3.95,-2.68) | 53.14 | ||
| Measured variables | Portion of explained difference | Portion of explained difference | ||||
| Absolute differences (CI) | P | Relative percentage (%) of total disparity | Absolute differences (CI) | P | Relative percentage (%) of total disparity | |
| Age | 0.20 (0.01,0.40) | 0.044 | -3.29 | 0.20 (0.01,0.40) | 0.044 | -3.24 |
| Sex | 0.48 (0.43,0.52) | <0.001 | -7.65 | 0.54 (0.49,0.59) | <0.001 | -8.71 |
| Race/ethnicity | 0.05 (0.02,0.07) | <0.001 | -0.75 | 0.02 (-0.01,0.04) | 0.196 | -0.25 |
| Nativity/Immigrant status | -0.12 (-0.14,-0.10) | <0.001 | 1.93 | -0.12 (-0.15,-0.10) | <0.001 | 1.95 |
| Education | -1.51 (-1.62,-1.41) | <0.001 | 24.27 | -1.32 (-1.42,-1.21) | <0.001 | 21.13 |
| Marital status | -0.28 (-0.37,-0.19) | <0.001 | 4.45 | -0.23 (-0.31,-0.14) | <0.001 | 3.61 |
| Poverty status (%) | -0.89 (-1.01,-0.77) | <0.001 | 14.24 | -0.73 (-0.85,-0.62) | <0.001 | 11.77 |
| Housing tenure (home ownership) | -0.35 (-0.41,-0.28) | <0.001 | 5.59 | -0.32 (-0.38,-0.26) | <0.001 | 5.11 |
| Region of residence | 0.00 (-0.01,0.01) | 0.370 | 0.07 | 0.00 (-0.01,0.01) | 0.864 | -0.01 |
| Body mass index (BMI) | 0.18 (0.12,0.23) | <0.001 | -2.83 | |||
| Smoking status | -0.84 (-0.94,-0.75) | <0.001 | 13.51 | |||
| Alcohol consumption | -0.30 (-0.36,-0.24) | <0.001 | 4.82 | |||
Sample size=263,825. Race/ethnicity includes Non-Hispanic Whites, Non-Hispanic Blacks, Hispanics, American Indians/Alaska Natives, Asian/Pacific Islanders, and Non-Hispanic other races. Education includes less than high school diploma, high school diploma, some college, and college degree or more. Poverty status includes the ratio of family income to poverty threshold of<100%; >=100% & <200%; >=200% & <400%; >=400%; missing. Region includes Northeast, Midwest, South, and West. BMI includes<25, 25-29, 30-39, ≥40, and missing. Smoking status includes never, former, and current smokers. Alcohol consumption includes lifetime abstainer, former drinker, current drinker, and unknown.
The sum total explained by measured variables includes counterbalancing factors, some of which contribute to and others diminish the disparity by SPD. The lower educational level for adults with SPD accounted for 1.51 percentage points of mortality difference by PD, or 24.27% of the total 6.23 percentage point mortality disparity (Model1). Thus, holding all other sociodemographic variables constant, higher educational attainment for adults with SPD would eliminate 24% of the all-cause mortality disparity between adults with no PD and those with SPD. Other sociodemographic factors made a smaller contribution to the disparity, including lower-income (14.24%), higher proportions of renters (5.59%), and higher proportions of non-currently-married individuals (4.45%) among adults with SPD. Some other factors that were positively associated with all-cause mortality mitigated the disparity, including higher proportions of females (-7.65%) and younger individuals (-3.29%). These are the factors that favored adults with SPD and would serve to increase all-cause mortality disparities between adults with no PD and those with SPD if equalized.
Similarly, the difference in educational attainment (-1.32 percentage points or 21.13%) was the highest contributor to all-cause mortality disparity between adults with no PD and those with SPD in Model2, which additionally examined the contribution of behavioral risk factors. The second highest contribution to all-cause mortality disparity was due to higher rates of current smoking among adults with SPD. The contributions of education, poverty status, marital status, and housing tenure slightly decreased, indicating that health behaviors such as smoking and alcohol consumption partly accounted for the impact of socio-demographic factors.
Decomposition analysis using a Fairlie non-linear approach34 as a sensitivity analysis yielded similar results, although the magnitude of the contributions varied (Table 3). There is a possibility of overestimation of the impact of the difference in poverty or education between adults with no PD and those with SPD on all-cause mortality difference.34 An additional sensitivity analysis was conducted to assess variations in the contributions of individual characteristics by using 2, 5, and 10 years of mortality follow-up. The longer the follow-up years, the larger the component explained by measured variables (Table 4). This might be because the longer follow-up allows for a greater manifestation of the lagged effect of smoking, BMI, drinking, and socioeconomic disadvantage on mortality. A third sensitivity analysis was conducted to examine variation by a reference group. We changed the reference group from adults with no PD (K6=0) to adults with no SPD (K6=0-12) (Table 5). The portion of explained difference by each determinant, statistical significance, and the direction of contribution were generally robust regardless of whether adults with no PD or adults with no SPD were used as a reference group, except for age and region of residence.
| Linear Model | Non-linear Model (Fairlie) | |||||
|---|---|---|---|---|---|---|
| Percentage points (CI) | Relative percentage (%) | Percentage points (CI) | Relative percentage (%) | |||
| Total difference between No PD (K6=0) and SPD (K6=13+) |
-6.23 (-6.92,-5.54) | 100 | -6.23 (-6.92,-5.54) | 100 | ||
| Component explained by measured variables | -2.92 | 46.86 | -2.12 | 34.02 | ||
| Measured variables | Portion of explained difference | Portion of explained difference | ||||
| Absolute differences (CI) | P | Relative percentages of total disparity | Absolute differences (CI) | P | Relative percentages of total disparity | |
| Age | 0.20 (0.01,0.40) | 0.044 | -3.24 | -0.10 (-0.14,-0.07) | <0.001 | 1.68 |
| Sex | 0.54 (0.49,0.59) | <0.001 | -8.71 | 0.57 (0.53,0.61) | <0.001 | -9.09 |
| Race/ethnicity | 0.02 (-0.01,0.04) | 0.196 | -0.25 | 0.00 (-0.01,0.02) | 0.671 | -0.05 |
| Nativity/Immigrant status | -0.12 (-0.15,-0.10) | <0.001 | 1.95 | -0.01 (-0.02,-0.01) | <0.001 | 0.19 |
| Education | -1.32 (-1.42,-1.21) | <0.001 | 21.13 | -0.64 (-0.70,-0.59) | <0.001 | 10.30 |
| Marital status | -0.23 (-0.31,-0.14) | <0.001 | 3.61 | -0.06 (-0.10,-0.01) | 0.007 | 0.88 |
| Poverty status (%) | -0.73 (-0.85,-0.62) | <0.001 | 11.77 | -0.33 (-0.43,-0.24) | <0.001 | 5.33 |
| Housing tenure (home ownership) | -0.32 (-0.38,-0.26) | <0.001 | 5.11 | -0.20 (-0.25,-0.15) | <0.001 | 3.23 |
| Region of residence | 0.00 (-0.01,0.01) | 0.864 | -0.01 | 0.00 (-0.01,0.01) | 0.882 | 0.01 |
| Body mass index (BMI) | 0.18 (0.12,0.23) | <0.001 | -2.83 | -0.05 (-0.09,0.00) | 0.047 | 0.77 |
| Smoking status | -0.84 (-0.94,-0.75) | <0.001 | 13.51 | -1.02 (-1.09,-0.95) | <0.001 | 16.36 |
| Alcohol consumption | -0.30 (-0.36,-0.24) | <0.001 | 4.82 | -0.27 (-0.31,-0.22) | <0.001 | 4.29 |
Sample size=263,825. Race/ethnicity includes Non-Hispanic Whites, Non-Hispanic Blacks, Hispanics, American Indians/Alaska Natives, Asian/Pacific Islanders, and Non-Hispanic other races. Education includes less than high school diploma, high school diploma, some college, and college degree or more. Poverty status includes the ratio of family income to poverty threshold of<100%; >=100% & <200%; >=200% & <400%; >=400%; missing. Region includes Northeast, Midwest, South, and West. BMI includes<25, 25-29, 30-39, ≥40, and missing. Smoking status includes never, former, and current smokers. Alcohol consumption includes lifetime abstainer, former drinker, current drinker, and unknown.
| ≤2 years of follow-up | ≤5 years of follow-up | ≤10 years of follow-up | ||||
|---|---|---|---|---|---|---|
| Percentage points (CI) | Relative percentage | Percentage points (CI) | Relative percentage | Percentage points (CI) | Relative percentage | |
| Total difference between No PD (K6=0) and SPD (K6=13+) | -19.91 (-22.93,-16.89) | 100% | -10.18 (-11.65,-8.70 | 100% | -7.72 (-8.75,-6.69) | 100% |
| Component explained by measured variables | -6.42 (-7.94,-4.89) | 32.23 % | -4.05 (-4.72,-3.39) | 39.85 % | -3.35 (-3.81,-2.90) | 43.44 % |
| Component unexplained by measured variables | -13.49 (-16.08,-10.91) | 67.77 % | -6.12 (-7.48,-4.76) | 60.15 % | -4.37 (-5.30,-3.43) | 56.56 % |
| Measured variables | Portion of explained difference | Portion of explained difference | Portion of explained difference | |||
| Absolute differences (CI) | Relative percentages of total disparity | Absolute differences (CI) | Relative percentages of total disparity | Absolute differences (CI) | Relative percentages of total disparity | |
| Age | -0.78 (-1.64,0.07) | 3.94 | -0.05 (-0.45,0.34) | 0.53 | 0.19 (-0.10,0.48) | -2.45 |
| Sex | 0.54 (0.31,0.76)*** | -2.69 | 0.68 (0.57,0.80)*** | -6.71 | 0.59 (0.51,0.66)*** | -7.62 |
| Race/ethnicity | 0.07 (-0.06,0.19) | -0.33 | -0.01 (-0.06,0.04) | 0.14 | -0.01 (-0.05,0.02) | 0.19 |
| Nativity/Immigrant status | -0.24 (-0.37,-0.11)*** | 1.22 | -0.19 (-0.26,-0.13)*** | 1.91 | -0.19 (-0.23,-0.15)*** | 2.48 |
| Education | -2.62 (-3.18,-2.06)*** | 13.17 | -2.01 (-2.26,-1.77)*** | 19.79 | -1.64 (-1.81,-1.48)*** | 21.29 |
| Marital status | -0.33 (-0.69,0.03) | 1.67 | -0.19 (-0.37,-0.01)* | 1.85 | -0.14 (-0.27,-0.01)* | 1.80 |
| Poverty status (%) | 0.32 (-0.28,0.93) | -1.62 | -0.12 (-0.40,0.16) | 1.16 | -0.60 (-0.79,-0.41)*** | 7.81 |
| Housing tenure (home ownership) | -0.34 (-0.58,-0.09)** | 1.69 | -0.39 (-0.53,-0.24)*** | 3.78 | -0.34 (-0.44,-0.24)*** | 4.38 |
| Region of residence | -0.05 (-0.14,0.04) | 0.24 | -0.02 (-0.04,0.01) | 0.15 | 0.00 (-0.02,0.02) | 0.03 |
| Body mass index (BMI) | 0.00 (-0.28,0.27) | 0.01 | 0.17 (0.04,0.30)** | -1.69 | 0.32 (0.23,0.41)*** | -4.18 |
| Smoking status | -2.08 (-2.55,-1.60)*** | 10.43 | -1.39 (-1.62,-1.16)*** | 13.63 | -1.14 (-1.30,-0.98)*** | 14.83 |
| Alcohol consumption | -0.90 (-1.26,-0.54)*** | 4.50 | -0.54 (-0.69,-0.39)*** | 5.30 | -0.38 (-0.47,-0.28)*** | 4.88 |
Sample size = 22,354 (≤2 years of follow-up), 77,755 (≤5 years of follow-up), 143,625 (≤10 years of follow-up). Race/ethnicity includes Non-Hispanic Whites, Non-Hispanic Blacks, Hispanics, American Indians/Alaska Natives, Asian/Pacific Islanders, and Non-Hispanic other races. Education includes less than high school diploma, high school diploma, some college, and college degree or more. Poverty status includes the ratio of family income to poverty threshold of <100%; >=100% & <200%; >=200% & <400%; >=400%; missing. Region includes Northeast, Midwest, South, and West. BMI includes <25, 25-29, 30-39, ≥40, and missing. Smoking status includes never, former, and current smokers. Alcohol consumption includes lifetime abstainer, former drinker, current drinker, and unknown.
| K6=0 vs. K6=13+ (N=263,825) | K6=0-12 vs. K6=13+ (N=520,777) | |||||
|---|---|---|---|---|---|---|
| Percentage points (CI) | Relative percentage (%) | Percentage points (CI) | Relative percentage (%) | |||
| Total difference between Two groups |
-6.23 (-6.92,-5.54) | 100 | -6.01 (-6.69,-5.34) | 100 | ||
| Component explained by measured variables | -2.92 (-3.21,-2.63) | 46.86 | -3.52 (-3.78,-3.25) | 58.51 | ||
| Component unexplained by measured variables | -3.31 (-3.95,-2.68) | 53.14 | -2.49 (-3.11,-1.88) | 41.49 | ||
| Measured variables | Portion of explained difference | Portion of explained difference | ||||
| Absolute differences (CI) | P | Relative percentage (%) of total disparity | Absolute differences (CI) | P | Relative percentage (%) of total disparity | |
| Age | 0.20 (0.01,0.40) | 0.044 | -3.24 | -0.40 (-0.60,-0.21) | <0.001 | 6.66 |
| Sex | 0.54 (0.49,0.59) | <0.001 | -8.71 | 0.36 (0.33,0.40) | <0.001 | -6.06 |
| Race/ethnicity | 0.02 (-0.01,0.04) | 0.196 | -0.25 | 0.03 (0.01,0.05) | <0.001 | -0.54 |
| Nativity/Immigrant status | -0.12 (-0.15,-0.10) | <0.001 | 1.95 | -0.06 (-0.08,-0.04) | <0.001 | 1.04 |
| Education | -1.32 (-1.42,-1.21) | <0.001 | 21.13 | -1.32 (-1.41,-1.24) | <0.001 | 21.98 |
| Marital status | -0.23 (-0.31,-0.14) | <0.001 | 3.61 | -0.12 (-0.20,-0.04) | 0.002 | 1.98 |
| Poverty status (%) | -0.73 (-0.85,-0.62) | <0.001 | 11.77 | -0.81 (-0.90,-0.73) | <0.001 | 13.55 |
| Housing tenure (home ownership) | -0.32 (-0.38,-0.26) | <0.001 | 5.11 | -0.29 (-0.34,-0.25) | <0.001 | 4.88 |
| Region of residence | 0.00 (-0.01,0.01) | 0.864 | -0.01 | -0.01 (-0.02,0.00) | 0.226 | 0.12 |
| Body mass index (BMI) | 0.18 (0.12,0.23) | <0.001 | -2.83 | 0.18 (0.13,0.22) | <0.001 | -2.91 |
| Smoking status | -0.84 (-0.94,-0.75) | <0.001 | 13.51 | -0.67 (-0.73,-0.61) | <0.001 | 11.20 |
| Alcohol consumption | -0.30 (-0.36,-0.24) | <0.001 | 4.82 | -0.40 (-0.45,-0.35) | <0.001 | 6.62 |
Race/ethnicity includes Non-Hispanic Whites, Non-Hispanic Blacks, Hispanics, American Indians/Alaska Natives, Asian/Pacific Islanders, and Non-Hispanic other races. Education includes less than high school diploma, high school diploma, some college, and college degree or more. Poverty status includes the ratio of family income to poverty threshold of<100%; >=100% & <200%; >=200% & <400%; >=400%; missing. Region includes Northeast, Midwest, South, and West. BMI includes <25, 25-29, 30-39, ≥40, and missing. Smoking status includes never, former, and current smokers. Alcohol consumption includes lifetime abstainer, former drinker, current drinker, and unknown.
4. Discussion
Our study contributes to the existing literature by quantifying the contributions of individual characteristics in explaining the observed mortality differences between adults with no PD and those with SPD. We found that low educational levels for adults with SPD accounted for 21.13% of the total 6.23 percentage point all-cause mortality difference by PD. Lower-income and higher proportions of current smokers and renters contributed to higher all-cause mortality for adults with SPD, while other factors mitigated this effect, including younger age, higher proportion of females, and higher BMI.
While females showed a higher prevalence of SPD than males, this higher proportion of females among adults with SPD negatively contributed to mortality disparity between adults with no PD and those with SPD. This finding is consistent with previous findings using sex-stratified Cox hazards regression models in terms of the fact that females had lower all-cause, heart disease, cancer mortality risks associated with SPD, compared to males.5,16,35 Regarding race/ethnicity in the full model, we did not find a statistically significant contribution to the mortality disparities net of other factors, although the proportion of racial/ethnic populations was different between an adult with no PD and those with SPD. One plausible explanation is that the difference in proportions of different races/ethnicities between the PD and SPD groups was less than one percent, except for Asian/Pacific Islanders.
Enhancing education level among adults with SPD would decrease approximately 21% of all-cause mortality disparity. Lower income is the third-highest contributor to higher all-cause mortality disparities. The increasing income level will decrease 12% of the disparity in all-cause mortality. Education and income, as the most commonly used indicators of SES, have long been studied as determinants of mental health.26,27,36 Our study contributes to the existing literature by providing evidence that the effect of depression on mortality could be attenuated if SES is controlled, using a single methodological frame for previous findings on the association between SES and depression, SES and life expectancy, or depression and mortality.5,22,26,27
Higher proportions of renters explain higher all-cause mortality among adults with SPD by 5%. Our findings are consistent with the previous study findings that homeowners experienced 4.1 years longer life expectancy than renters22 and housing tenure and cost concerns are associated with lack of health insurance, higher prevalence of ER visits, pre-existing conditions, violent crime, and higher risks of heart disease and COPD.24,37 Further studies need to examine other aspects of housing such as residential segregation, crowding, housing safety, and conditions, cost concerns, and community resources among adults with SPD and their association with mortality disparities.24,37,38
Holding all other variables constant, smoking cessation for adults with SPD would eliminate around 14% of all-cause mortality disparity between adults with no PD and those with SPD. Given that smokers with SPD smoke a higher average number of cigarettes per day,39 and those without mental health treatment are less likely to quit smoking,40 our findings call for tobacco control policies or cessation intervention targeting adults with SPD to mitigate mortality disparities by mental health. Adults with overweight (BMI 25 to < 30 kg/m2) or obesity (BMI ≥30) showed a higher prevalence of SPD but this higher prevalence of SPD among adults with overweight or obesity negatively contributed (mitigate) to mortality disparity between adults with no PD and those with SPD. This might be explained by the fact that a higher BMI’s favorable effect on health mitigates mortality related to SPD since adults with overweight or obesity have been shown to have a lower relative risk of mortality than male adults with normal weight.41
4.1. Limitations
This study has some limitations First, our study used an NHIS sample eligible for linkage to the NDI, which is, on average, 94.8% of the original NHIS survey participants.33 Excluding records ineligible for linkage may lead to biased mortality estimates. To address potential bias, we used the eligibility-adjusted sampling weight to account for the NHIS-NDI mismatches.33 Second, while our Blinder-Oaxaca decomposition included a variety of risk factors of all-cause mortality, there could be other potential factors of mortality, confounding existing risk factors. Third, in the NHIS-NDI database, all the risk factors were available at baseline as of the survey date, while SES, behavioral-risk factors, and PD are expected to vary over the long follow-up. It is worthwhile to examine the extent of changes in SES or behavioral factors from childhood, working-age, to older ages contributing to the disparities in mortality by SPD status, using the life course approach36 with longitudinal data.
5. Conclusions and Global Health Implications
In a nationally representative study, we found that disparities in education level was the top contributor to the all-cause mortality disparity between adults with no PD and those with SPD, and income and smoking status also attribute higher mortality among adults with SPD. Reducing rates of these three social and behavioral determinants among adults with SPD might eliminate approximately half of the all-cause mortality disparity. Similar patterns of mortality inequalities by psychological distress may also hold for low- and middle-income countries, with tobacco use, physical inactivity, unhealthy diet, the harmful use of alcohol, and unfavorable socioeconomic conditions contributing greatly to increased morbidity and mortality risks.42
Acknowledgments:
None.
Compliance with Ethical Standards
Conflicts of Interests: The authors declare no competing interest.
Financial Disclosure: None to report.
Funding Source: There was no funding for this study.
Ethics Approval: The study was exempt from Institutional Review Board approval as it utilized a de-identified public use dataset.
Disclaimer: None
References
- Early release of selected estimates based on data from the 2019 national health interview survey. National Center for Health Statistics. Published 2020 https: //www.cdc.gov/nchs/data/nhis/earlyrelease/EarlyReleas|ne202009-508.pdf
- [Google Scholar]
- National Health Interview Survey, Sample Adult Core Component. Tableau Public. Updated May 30, 2019 https: //public.tableau.com/profile/tina.norris#!/vizhome/FIGURE13_1/Dashboard13_1
- Distribution of psychological distress is stable in recent decades and follows an exponential pattern in the US population. Sci Rep. 2019;9(1):1-10. doi: 10.1038/s41598-019-47322-1
- [Google Scholar]
- HHS Publication No. SMA-14-4883. Substance Abuse and Mental Health Services Administration (SAMHSA). Published October 2014 https: //store.samhsa.gov/product/Projections-of-National-Expenditures-for-Treatment-of-Mental-and-Substance-Use-Disorders-2010-2020/SMA14-4883
- Psychological distress, life expectancy, and all-cause mortality in the United States: results from the 1997–2014 NHIS-NDI record linkage study. Ann Epidemiol. 2021;56:9-17. doi: 10.1016/j.annepidem.2021.01.002
- [Google Scholar]
- Serious psychological distress among adults: United States, 2009–2013. NCHS Data Brief. 2015;203:1-8.
- [Google Scholar]
- Serious psychological distress, as measured by the K6, and mortality. Ann Epidemiol. 2009;19(3):202-209. doi: 10.1016/j.annepidem.2008.12.005
- [Google Scholar]
- Association between psychological distress and mortality: individual participant pooled analysis of 10 prospective cohort studies. BMJ. 2012;345:e4933. doi: 10.1136/bmj.|ne4933
- [Google Scholar]
- Psychological distress, physical illness and mortality risk. J Psychosom Res. 2004;57(3):231-236. doi: 10.1016/S0022-3999(03)00618-4
- [Google Scholar]
- Psychological distress and premature mortality in the general population: a prospective study. Ann Epidemiol. 2004;14(7):467-472. doi: 10.1016/j.annepidem.2003.11.007
- [Google Scholar]
- Psychological distress and mortality among adults in the U.S. household population. Substance Abuse and Mental Health Services Administration. Published August 2014 https: //www.samhsa.gov/data/sites/default/files/CBHSQ-DR-C11-MI-Mortality-2014/CBHSQ-DR-C11-MI-Mortality-2014.htm
- [Google Scholar]
- Psychological distress in relation to site specific cancer mortality: pooling of unpublished data from 16 prospective cohort studies. BMJ. 2017;356:j108. doi: 10.1136/bmj.j108
- [Google Scholar]
- Psychological distress and cancer mortality. J Psychosom Res. 2009;66(3):255-258. doi: 10.1016/j.jpsychores.2008.11.002
- [Google Scholar]
- Excess mortality due to depression and anxiety in the United States: results from a nationally representative survey. Gen Hosp Psychiatry. 2016;39:39-45. doi: 10.1016/j.genhosppsych.2015.12.003
- [Google Scholar]
- Psychological distress and heart disease mortality in the United States: results from the 1997-2014 NHIS-NDI Record Linkage Study. Int J MCH AIDS. 2020;9(3):260-273. doi: 10.21106/ijma.391
- [Google Scholar]
- Depression and mortality in a longitudinal study: 1952–2011. CMAJ. 2017;189(42):E1304-E1310. doi: 10.1503/cmaj.170125
- [Google Scholar]
- Who's stressed?Distributions of psychological stress in the United States in probability samples from 1983, 2006, and 2009 1. J Appl Soc Psychol. 2012;42(6):1320-1334.
- [Google Scholar]
- It is better to be a fat ex-smoker than a thin smoker: findings from the 1997–2004 National Health Interview Survey- National Death Index linkage study. Tob Control. 2014;23(5):395-402. doi: 10.1136/tobaccocontrol-2012-050912
- [Google Scholar]
- Cancer disparities by race/ethnicity and socioeconomic status. CA Cancer J Clin. 2004;54(2):78-93. doi: 10.3322/canjclin.54.2.78
- [Google Scholar]
- Socioeconomic and racial/ethnic disparities in cancer mortality, incidence, and survival in the United States, 1950–2014: over six decades of changing patterns and widening inequalities. J Environ Public Health 2017. ;2017(2819372) doi: 10.1155/2017/2819372
- [Google Scholar]
- Marked disparities in life expectancy by education, poverty level, occupation, and housing tenure in the United States, 1997-2014. Int J MCH AIDS. 2021;10(1):7-18. doi: 10.21106/ijma.402
- [Google Scholar]
- Social determinants of health in the United States: addressing major health inequality trends for the nation, 1935-2016. Int J MCH AIDS. 2017;6(2):139-164. doi: 10.21106/ijma.236
- [Google Scholar]
- Health Equity Report 2019-2020: Special Feature on Housing and Health Inequalities. Rockville, Maryland: Health Resources and Services Administration. Office of Health Equity; 2020.
- Sociodemographic characteristics, financial worries and serious psychological distress in US adults. Community Ment Health J. 2020;56:606-613. doi: 10.1007/s10597-019-00519-0
- [Google Scholar]
- Understanding the association between socioeconomic status and physical health: do negative emotions play a role? Psychol Bull. 2003;129(1):10-51. doi: 10.1037/0033-2909.129.1.10
- [Google Scholar]
- Socioeconomic inequalities in depression: a meta-analysis. Am J Epidemiol. 2003;157(2):98-112. doi: 10.1093/aje/kwf182
- [Google Scholar]
- 2019. National Health Interview Survey, Version 6.4 [dataset]. Minneapolis, MN: University of Minnesota; https: //doi.org/10.18128/D070.V6.4
- Public-Use Linked Mortality File. National Center for Health Statistics Data Linkage 2019
- [Google Scholar]
- The Blinder–Oaxaca decomposition for linear regression models. Stata J. 2008;8(4):453-479.
- [Google Scholar]
- Analyzing Health Equity Using Household Survey Data Analyzing: A Guide to Techniques and Their Implementation. 2008. WBI Learning Resources Series. Washington, D.C.: The World Bank; http: //www.worldbank.org/content/dam/Worldbank/document/HDN/Health/HealthEquityCh12.pdf
- [Google Scholar]
- Stata Statistical Software: Release 17 2021
- The Linkage of National Center for Health Statistics Survey Data to the National Death Index —2015 Linked Mortality File (LMF): Methodology Overview and Analytic Considerations. National Center for Health Statistics Data Linkage 2019
- [Google Scholar]
- An extension of the Blinder-Oaxaca decomposition technique to logit and probit models. J Econ Soc Meas. 2005;30(4):305-316.
- [Google Scholar]
- The association between psychological distress and cancer mortality in the United States: results from the 1997–2014 NHIS-NDI record linkage study. Ann Behav Med. 2021;55(7):621-640. doi: 10.1093/abm/kaaa111
- [Google Scholar]
- Social determinants of mental health. Int Rev Psychiatry. 2014;26(4):392-407. doi: 10.3109/09540261.2014.928270
- [Google Scholar]
- Housing and health: time again for public health action. Am J Public Health. 2002;92(5):758-768. doi: 10.2105/ajph.92.5.758
- [Google Scholar]
- WHO Housing and Health Guidelines. Geneva: World Health Organization; 2018.
- Smoking and mental illness: results from population surveys in Australia and the United States. BMC Public Health. 2009;9(1):285. doi: 10.1186/1471-2458-9-285
- [Google Scholar]
- Trends in smoking among adults with mental illness and association between mental health treatment and smoking cessation. JAMA. 2014;311(2):172-182. doi: 10.1001/jama.2013.284985
- [Google Scholar]
- It is better to be a fat ex-smoker than a thin smoker: Findings from the 1997-2004 national health interview survey-national death index linkage study. Tob Control. 2014;23(5):395-402. doi: 10.1136/tobaccocontrol-2012-050912
- [Google Scholar]
- Global, regional, and national comparative risk assessment of 79 behavioural, environmental and occupational, and metabolic risks or clusters of risks, 1990–2015: a systematic analysis for the Global Burden of Disease Study 2015. Lancet. 2016;388(10053):1659-1724. doi: 10.1016/S0140-6736(16)31679-8
- [Google Scholar]