Translate this page into:
Marked Disparities in Life Expectancy by Education, Poverty Level, Occupation, and Housing Tenure in the United States, 1997-2014
#x002A;Corresponding author: email: gsingh@hrsa.gov
-
Received: ,
Accepted: ,
This is an open-access article distributed under the terms of the Creative Commons Attribution-Noncommercial-Share Alike 3.0 Unported, which permits unrestricted use, distribution, and reproduction in any medium, provided the original work is properly cited.
Abstract
Objectives:
Socioeconomic disparities in life expectancy in the United States (US) are marked and have widened over time. However, there is limited research using individual-level socioeconomic variables as such information is generally lacking or unreliable in vital records used for life table construction. Using longitudinal cohort data, we computed life expectancy for US adults by social determinants such as education, income/poverty level, occupation, and housing tenure.
Methods:
We analyzed the 1997-2014 National Health Interview Survey prospectively linked to mortality records in the National Death Index (N=1,146,271). Standard life table methodologies were used to compute life expectancy and other life table functions at various ages according to socioeconomic variables stratified by sex and race/ethnicity.
Results:
Adults with at least a Master’s degree had 14.7 years higher life expectancy at age 18 than those with less than a high school education and 8.3 years higher life expectancy than those with a high school education. Poverty was inversely related to life expectancy. Individuals living in poverty had 10.5 years lower life expectancy at age 18 than those with incomes ≥400% of the poverty threshold. Laborers and those employed in craft and repair occupations had, respectively, 10.9 years and 8.6 years lower life expectancy at age 18 than those with professional and managerial occupations. Male and female renters had, respectively, 4.0 years and 4.6 years lower life expectancy at age 18 than homeowners. Women in the most advantaged socioeconomic group outlived men in the most disadvantaged group by 23.5 years at age 18.
Conclusions and Global Health Implications:
Marked socioeconomic gradients in US life expectancy were found across all sex and racial/ethnic groups. Adults with lower education, higher poverty levels, in manual occupations, and with rental housing had substantially lower life expectancy compared to their counterparts with higher socioeconomic position.
Keywords
Life expectancy
Education
Poverty
Occupation
Housing Tenure
Social determinants
Longitudinal

1. Introduction
Life expectancy has long been considered an important indicator of a nation’s health and well-being and human development.1-3 For over three decades, reducing health inequalities and increasing life expectancy among Americans have been the two most important health policy goals for the United States (US).1,4 Although life expectancy estimates for the US are routinely reported by sex, race/ethnicity, rural-urban residence, and geographic area,5-8 they are not readily available by individual measures of socioeconomic status (SES). A number of studies have shown persistent or widening socioeconomic disparities in life expectancy over time both in the US and other Western nations such as Canada, the United Kingdom, Australia, and New Zealand.1,9-14 Life expectancy disparities have widened as people in higher SES groups or in more affluent communities have experienced larger gains in life expectancy than their disadvantaged counterparts.9-11
Many of these studies have used area-based socioeconomic deprivation measures to study disparities in life expectancy in the absence of patient-level socioeconomic data in administrative databases, including the vital statistics-based national mortality database in the US.1,6,9,10 Few studies have analyzed variations in life expectancy according to individual SES measures, using longitudinal cohort data for the US.15-18 Efforts have been made to estimate life expectancy using educational attainment data on the death certificate, but the quality of education data, especially for decedents aged 65 years and older, remains poor and unreliable.5,19 Prospective linkages of population surveys and census cohorts with disease registries and mortality records have enabled recent studies to examine differentials in life expectancy by individual or household income, education, and occupation,15-17 but none have tackled the issue of life expectancy disparities using a wide range of individual-level social determinants.
To address the continuing gap in research on life expectancy disparities by individual-level SES, we examine variations in life expectancy among US adults with different levels of education, income/poverty status, occupations, and housing tenure (home ownership vs. renting house) across gender and racial/ethnic groups, using a nationally representative longitudinal dataset containing 18-years of mortality follow-up. Assessing inequalities in life expectancy according to key social determinants such as education, poverty, employment, and housing status is important in that it provides information on the extent to which life expectancy can be improved among various socioeconomic and demographic groups in a given population. Monitoring social inequalities in leading health indicators, such as life expectancy, is important for policy formulation and to set and support targets for reducing health disparities and achieving health equity.6,11,12
Life expectancy is a summary measure of mortality that can be used to document both absolute and relative inequalities in survival between social groups and populations with low, medium, and high levels of socioeconomic position.1,8,9 It shows the effects of excess mortality risks during childhood, youth, working ages, and old age as well as those from major communicable and non-communicable diseases and injuries. The aim of our study is to estimate SES disparities in life expectancy across gender and major racial/ethnic groups in the United States during 1997-2014.
2. Methods
The data source for this study was the 1997-2014 National Health Interview Survey (NHIS) prospectively linked to the National Death Index (NDI).20 NHIS is a nationally representative, cross-sectional household interview survey that provides socio-economic, demographic, and health characteristics of the US civilian, non-institutionalized population. We used the public-use linked NHIS-NDI mortality file, developed by the National Center for Health Statistics, that contains 18 years of mortality follow-up data from the date of survey participation through December 31, 2014.21
The study sample was restricted to adults aged 18 years and older in the database as the public-use linked file did not include deaths among those aged under 18 at baseline. The sample ineligible for mortality follow-up was eliminated from the analysis. The final pooled sample size was 1,146,271. Each of the four SES variables selected for life table construction had missing data: education (1.56%), poverty status (20.07%), occupation (the category for unemployed and those outside the labor force (62.49%)), and housing tenure (1.16%). We computed life expectancy estimates only for the known categories of the SES variables.
Follow-up time for individuals who died during the study period was defined by the number of months from the month/year of interview to the month/year of death. Since the NHIS-NDI file provides only the quarter of death, we assumed that death occurred in the middle month of the quarter, February, May, August, or November.22 The mean follow-up time for the sample was 8.2 years.
The four SES variables were measured as follows. Educational attainment consisted of five categories: less than high school diploma, high school diploma, some college, Bachelor’s degree, and Master’s degree or higher. Poverty status, defined as the ratio of family income to poverty threshold consisted of 5 categories: <100%, 100-199%, 200-299%, 200-399%, and ≥400%. Housing tenure included two categories: homeowners and renters. Detailed occupation categories were collapsed into 5 broad occupational groups: professional and managerial, sales/ clerical and technical support, service, craft and repair, and laborers. These broad occupational groups, derived from the major occupational groups defined by the Census Bureau, are consistent with previously defined social class positions of upper white collar, lower white collar, upper blue collar, and lower blue collar jobs.23
We used the standard life table methodology to calculate life expectancy at age 18 and subsequent ages along with standard errors.24,25 Specifically, life expectancy was estimated by converting age-specific mortality rates (for 14 age groups: 18-24, 25-29, 30-34, 35-39, 40-44, 45-49, 50-54, 55-59, 60-64, 65-69, 70-74, 75-79, 80-84, and ≥85 years) into life-table probabilities of dying, allowing computation of various life-table functions. Age-specific mortality rates were computed based on person-years of exposure for each SES category. In computing person-years for age-specific mortality rates, deaths were assumed to occur uniformly throughout the follow-up period rather than being clustered in the first part of the period. We tested for differences in life expectancy estimates by SES levels across gender, race/ethnicity, and age.
3. Results
3.1. Educational Disparities in Life Expectancy
Table 1 presents life expectancy by educational attainment for the total population, males, females, and three racial/ethnic groups. Educational attainment was positively and consistently related to life expectancy for all groups except Hispanics. Adults with at least a Master’s degree had a life expectancy of 61.4 years at age 18, 14.7 years higher life expectancy than those with less than a high school education (46.7 years), and 8.3 years higher life expectancy than those with a high school education (53.1 years). Persons with a Master’s degree or higher had one year higher life expectancy at age 18 than those with a bachelor’s degree. Similar educational patterns in life expectancy can be noted at ages 45 and 65. Educational differentials in life expectancy were larger for men than for women (Figure 1).
| Both Sexes | Male | Female | ||||
|---|---|---|---|---|---|---|
| LE | SE | LE | SE | LE | SE | |
| Sample size | 1,128,409 | 531,943 | 596,466 | |||
| Age 18 | ||||||
| Less than high school | 46.70 | 0.11 | 44.03 | 0.15 | 49.51 | 0.15 |
| High school diploma | 53.13 | 0.08 | 50.31 | 0.12 | 55.77 | 0.11 |
| Some college | 56.20 | 0.09 | 53.09 | 0.13 | 58.94 | 0.12 |
| Bachelor’s degree | 60.40 | 0.12 | 58.23 | 0.17 | 62.80 | 0.18 |
| Master’s degree or higher | 61.39 | 0.25 | 59.89 | 0.36 | 63.59 | 0.35 |
| Age 45 | ||||||
| Less than high school | 25.55 | 0.08 | 23.79 | 0.11 | 27.24 | 0.12 |
| High school diploma | 30.32 | 0.07 | 28.25 | 0.10 | 31.99 | 0.09 |
| Some college | 32.40 | 0.08 | 29.91 | 0.11 | 34.54 | 0.11 |
| Bachelor’s degree | 35.22 | 0.11 | 33.40 | 0.15 | 37.33 | 0.17 |
| Master’s degree or higher | 36.26 | 0.14 | 34.84 | 0.18 | 38.38 | 0.22 |
| Age 65 | ||||||
| Less than high school | 13.34 | 0.06 | 12.16 | 0.09 | 14.32 | 0.08 |
| High school diploma | 16.28 | 0.06 | 14.93 | 0.09 | 17.18 | 0.08 |
| Some college | 17.38 | 0.08 | 15.59 | 0.11 | 18.80 | 0.11 |
| Bachelor’s degree | 18.81 | 0.11 | 17.54 | 0.15 | 20.29 | 0.16 |
| Master’s degree or higher | 19.51 | 0.13 | 18.64 | 0.17 | 21.00 | 0.22 |
| NHW | NHB | Hispanics | ||||
| Sample size | 686,533 | 151,729 | 224,222 | |||
| Age 18 | ||||||
| Less than high school | 45.55 | 0.18 | 44.82 | 0.30 | 49.93 | 0.18 |
| High school diploma | 53.34 | 0.10 | 52.64 | 0.22 | 56.10 | 0.27 |
| Some college | 56.46 | 0.10 | 55.99 | 0.29 | 58.12 | 0.36 |
| Bachelor’s degree | 60.42 | 0.14 | 59.57 | 0.49 | 60.64 | 0.55 |
| Master’s degree or higher | 61.76 | 0.26 | 62.53 | 0.60 | 60.05 | 0.82 |
| Age 45 | ||||||
| Less than high school | 23.17 | 0.13 | 23.57 | 0.21 | 29.94 | 0.16 |
| High school diploma | 29.97 | 0.08 | 30.06 | 0.20 | 34.45 | 0.27 |
| Some college | 32.12 | 0.09 | 32.67 | 0.28 | 35.58 | 0.37 |
| Bachelor’s degree | 34.92 | 0.12 | 34.66 | 0.47 | 36.29 | 0.53 |
| Master’s degree or higher | 36.11 | 0.15 | 36.91 | 0.58 | 35.74 | 0.61 |
| Age 65 | ||||||
| Less than high school | 11.94 | 0.08 | 13.20 | 0.15 | 16.61 | 0.14 |
| High school diploma | 15.71 | 0.06 | 17.43 | 0.20 | 20.36 | 0.28 |
| Some college | 16.93 | 0.08 | 18.66 | 0.30 | 20.55 | 0.39 |
| Bachelor’s degree | 18.26 | 0.12 | 19.56 | 0.49 | 19.85 | 0.54 |
| Master’s degree or higher | 19.14 | 0.14 | 21.49 | 0.59 | 18.84 | 0.60 |
LE=Life expectancy, SE=standard error, NHW=non-Hispanic Whites, NHB=non-Hispanic Blacks
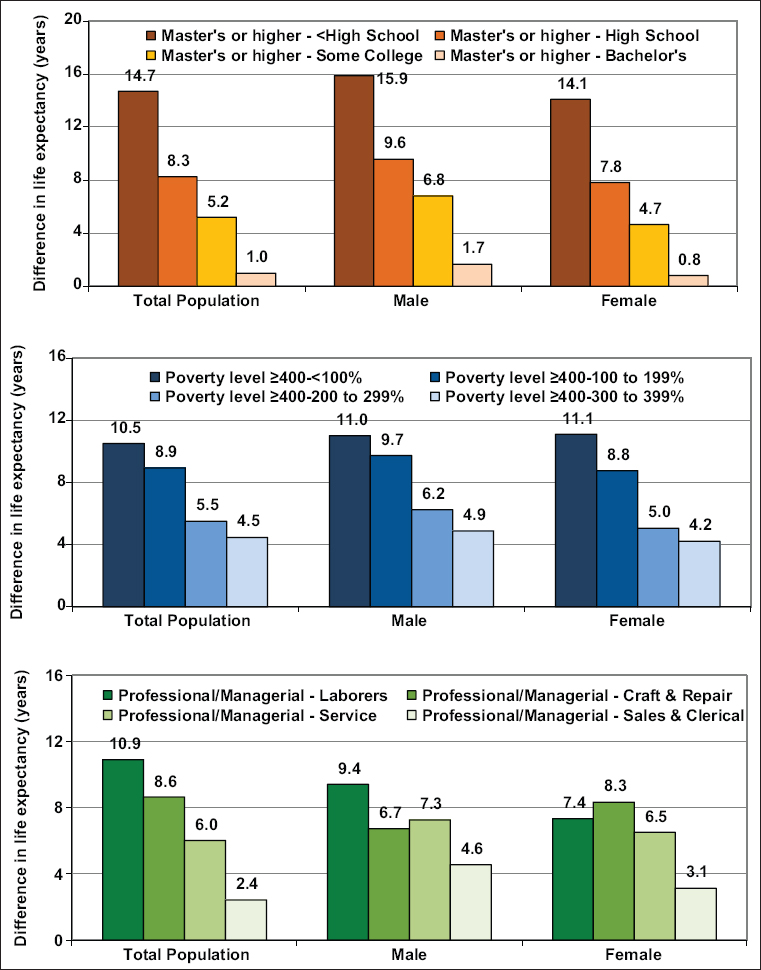
- Differences in Life Expectancy at Age 18 Across Education, Poverty, and Occupation Groups, United States, 1997-2014 Gradients in life expectancy by education, poverty level, and occupation were statistically significant at p<0.001. All life expectancy differences between the highest socioeconomic category and other categories were statistically significant at p<0.01, except for the difference between Master’s degree or higher and bachelor’s degree for women (p<0.05)
Educational differentials in life expectancy were larger for non-Hispanic Blacks than for non-Hispanics Whites and Hispanics. The difference in life expectancy at age 18 between persons with at least a Master’s degree and those with less than a high school education was 17.7 years for non-Hispanic Blacks, 16.2 years for non-Hispanic Whites, and 10.1 years for Hispanics. For educational categories from less than high school to bachelor’s degree, blacks had significantly lower life expectancy than non-Hispanic Whites and Hispanics. However, at age 18, non-Hispanic Blacks with at least a Master’s degree had a life expectancy of 62.5 years, significantly higher than the life expectancy of 60.1 and 61.8 years for Hispanics and Non-Hispanic Whites with similar educational attainment.
3.2. Disparities in Life Expectancy by Income/Poverty Level
Higher poverty levels were associated with lower life expectancy for each age, gender, and racial/ethnic group (Table 2). Compared to those with incomes ≥400% of the poverty threshold, individuals living in poverty and those with family incomes at 100-199% of the poverty level had, respectively, 10.5 years and 8.9 years lower life expectancy at age 18. Income/poverty differentials in life expectancy were similar for men and women (Figure 1). At age 65, men with incomes ≥400% of the poverty threshold had a life expectancy of 18.0 years, 3.9 years longer than that for men living in poverty (14.1 years). At age 65, women with incomes ≥400% of the poverty threshold had a life expectancy of 20.5 years, 5.1 years longer than that for women living in poverty (15.4 years). At each age and income/poverty level, women had significantly higher life expectancy than men.
| Both Sexes | Male | Female | ||||
|---|---|---|---|---|---|---|
| LE | SE | LE | SE | LE | SE | |
| Sample size | 916,190 | 434,443 | 481,747 | |||
| Age 18 | ||||||
| <100% | 49.20 | 0.13 | 46.30 | 0.21 | 51.35 | 0.17 |
| 100-199% | 50.78 | 0.11 | 47.57 | 0.16 | 53.69 | 0.15 |
| 200-299% | 54.20 | 0.12 | 51.06 | 0.17 | 57.40 | 0.16 |
| 300-399% | 55.24 | 0.14 | 52.41 | 0.19 | 58.23 | 0.19 |
| ≥400% | 59.70 | 0.10 | 57.29 | 0.13 | 62.44 | 0.14 |
| Age 45 | ||||||
| <100% | 26.82 | 0.12 | 25.03 | 0.19 | 28.10 | 0.16 |
| 100-199% | 27.88 | 0.10 | 25.60 | 0.14 | 29.80 | 0.13 |
| 200-299% | 30.69 | 0.10 | 28.33 | 0.14 | 33.00 | 0.15 |
| 300-399% | 31.28 | 0.12 | 29.07 | 0.17 | 33.57 | 0.17 |
| ≥400% | 35.20 | 0.08 | 33.37 | 0.11 | 37.26 | 0.12 |
| Age 65 | ||||||
| <100% | 14.91 | 0.11 | 14.07 | 0.18 | 15.39 | 0.14 |
| 100-199% | 14.76 | 0.08 | 13.26 | 0.11 | 15.84 | 0.10 |
| 200-299% | 16.42 | 0.09 | 14.79 | 0.12 | 17.97 | 0.13 |
| 300-399% | 16.42 | 0.11 | 15.01 | 0.15 | 17.85 | 0.16 |
| ≥400% | 19.17 | 0.09 | 18.01 | 0.11 | 20.47 | 0.13 |
| NHWY | NHB | Hispanics | ||||
| Sample size | 557,459 | 121,717 | 182,780 | |||
| Age 18 | ||||||
| <100% | 48.14 | 0.21 | 47.95 | 0.27 | 52.00 | 0.27 |
| 100-199% | 50.41 | 0.15 | 50.76 | 0.27 | 52.98 | 0.24 |
| 200-299% | 54.13 | 0.14 | 55.11 | 0.35 | 55.75 | 0.34 |
| 300-399% | 55.30 | 0.16 | 55.36 | 0.45 | 57.28 | 0.56 |
| ≥400% | 59.76 | 0.10 | 59.63 | 0.41 | 59.13 | 0.39 |
| Age 45 | ||||||
| <100% | 25.12 | 0.18 | 25.34 | 0.24 | 30.58 | 0.26 |
| 100-199% | 26.58 | 0.13 | 27.63 | 0.24 | 31.45 | 0.23 |
| 200-299% | 29.98 | 0.12 | 31.60 | 0.32 | 33.85 | 0.32 |
| 300-399% | 30.91 | 0.14 | 31.60 | 0.42 | 35.09 | 0.57 |
| ≥400% | 34.93 | 0.09 | 35.66 | 0.38 | 35.83 | 0.37 |
| Age 65 | ||||||
| <100% | 13.51 | 0.16 | 14.37 | 0.22 | 17.13 | 0.25 |
| 100-199% | 13.91 | 0.09 | 15.16 | 0.20 | 17.33 | 0.21 |
| 200-299% | 15.78 | 0.10 | 17.80 | 0.31 | 19.28 | 0.33 |
| 300-399% | 15.92 | 0.12 | 17.35 | 0.44 | 20.76 | 0.62 |
| ≥400% | 18.71 | 0.09 | 20.93 | 0.42 | 20.34 | 0.39 |
LE=Life expectancy, SE=standard error, NHW=non-Hispanic Whites, NHB=non-Hispanic Blacks.1Poverty status is the ratio of family income to poverty threshold (%)
Income/poverty differentials in life expectancy were larger for non-Hispanic Blacks and non-Hispanics Whites than for Hispanics. However, within each income/poverty stratum except for the most affluent category, Hispanics had higher life expectancy at age 18 than Non-Hispanic Whites and Non-Hispanic Blacks. For the highest-income category, the three racial/ethnic groups had similar life expectancies at age 18 (Table 2).
3.3. Occupational Disparities in Life Expectancy
Life expectancy at age 18 was highest among adults employed in professional and managerial occupations (64.0 years), followed by those in sales/clerical/technical support occupations (61.6 years), service occupations (58.0 years), craft and repair occupations (55.4 years), and laborers (53.1 years) [Table 3]. Occupational differentials in life expectancy were larger for men than for women (Figure 1), and within each occupational category, women had substantially higher life expectancy than men. Occupational disparities in life expectancy were larger for non-Hispanic Blacks than for non-Hispanic Whites and Hispanics. Non-Hispanic Blacks in professional and managerial occupations had the highest life expectancy at age 18 (66.1 years), at least two years longer than their non-Hispanic White counterparts (63.9 years) and Hispanic counterparts (64.1 years) [Table 3].
| Both Sexes | Male | Female | ||||
|---|---|---|---|---|---|---|
| LE | SE | LE | SE | LE | SE | |
| Sample size | 418,332 | 195,585 | 222,747 | |||
| Age 18 | ||||||
| Professional and managerial | 64.01 | 0.16 | 60.97 | 0.22 | 67.00 | 0.22 |
| Sales/clerical and tech support | 61.58 | 0.16 | 56.41 | 0.28 | 63.86 | 0.20 |
| Service | 57.98 | 0.20 | 53.70 | 0.32 | 60.49 | 0.25 |
| Craft and repair | 55.37 | 0.21 | 54.23 | 0.23 | 58.66 | 0.42 |
| Laborer | 53.09 | 0.32 | 51.55 | 0.35 | 59.65 | 0.73 |
| Age 45 | ||||||
| Professional and managerial | 39.16 | 0.14 | 36.37 | 0.20 | 41.95 | 0.20 |
| Sales/clerical and tech support | 37.63 | 0.15 | 33.08 | 0.26 | 39.54 | 0.18 |
| Service | 34.83 | 0.18 | 31.39 | 0.29 | 36.68 | 0.23 |
| Craft and repair | 33.07 | 0.17 | 32.08 | 0.20 | 35.42 | 0.33 |
| Laborer | 30.95 | 0.27 | 29.79 | 0.30 | 35.72 | 0.66 |
| Age 65 | ||||||
| Professional and managerial | 23.28 | 0.14 | 21.05 | 0.19 | 25.58 | 0.20 |
| Sales/clerical and tech support | 22.78 | 0.14 | 19.25 | 0.25 | 24.05 | 0.16 |
| Service | 20.85 | 0.17 | 18.12 | 0.29 | 22.11 | 0.21 |
| Craft and repair | 19.68 | 0.16 | 18.81 | 0.19 | 21.24 | 0.27 |
| Laborer | 18.16 | 0.26 | 17.26 | 0.28 | 21.62 | 0.62 |
| NHW | NHB | Hispanics | ||||
| Sample size | 268,551 | 59,810 | 68,486 | |||
| Age 18 | ||||||
| Professional and managerial | 63.90 | 0.17 | 66.12 | 0.60 | 64.07 | 0.71 |
| Sales/clerical and tech support | 61.71 | 0.19 | 62.24 | 0.59 | 64.01 | 0.73 |
| Service | 57.43 | 0.26 | 57.00 | 0.43 | 62.53 | 0.58 |
| Craft and repair | 55.58 | 0.25 | 55.95 | 0.59 | 56.82 | 0.54 |
| Laborer | 53.40 | 0.40 | 52.92 | 0.71 | 54.86 | 0.81 |
| Age 45 | ||||||
| Professional and managerial | 38.77 | 0.15 | 42.12 | 0.57 | 40.19 | 0.69 |
| Sales/clerical and tech support | 37.29 | 0.16 | 38.76 | 0.58 | 41.46 | 0.75 |
| Service | 33.63 | 0.24 | 33.77 | 0.39 | 40.89 | 0.58 |
| Craft and repair | 32.48 | 0.20 | 33.11 | 0.48 | 36.43 | 0.51 |
| Laborer | 30.31 | 0.34 | 30.05 | 0.61 | 35.28 | 0.76 |
| Age 65 | ||||||
| Professional and managerial | 22.67 | 0.15 | 27.98 | 0.56 | 24.92 | 0.70 |
| Sales/clerical and tech support | 22.29 | 0.15 | 24.95 | 0.61 | 27.01 | 0.78 |
| Service | 19.75 | 0.22 | 20.68 | 0.37 | 26.29 | 0.60 |
| Craft and repair | 18.91 | 0.18 | 20.83 | 0.46 | 23.13 | 0.50 |
| Laborer | 17.43 | 0.32 | 18.19 | 0.62 | 21.84 | 0.73 |
LE=Life expectancy, SE=standard error, NHW=non-Hispanic Whites, NHB=non-Hispanic Blacks. 1Occupation was recoded based on a modified variable of the 1995 revised Standard Occupational Classification-based codes, offering a consistent long-term classification of occupations
3.4. Disparities in Life Expectancy by Housing Tenure (Homeownership vs. Renting)
At age 18, life expectancy of homeowners was 4.1 years longer than that for renters (55.2 vs. 51.1 years) [Table 4]. The life expectancy gap by housing tenure was greater for women than for men, and for non-Hispanic Whites than for non-Hispanic Blacks and Hispanics. At age 18, female homeowners had a life expectancy of 57.9 years, 5.4 years longer than the life expectancy of 52.5 years for male homeowners. Female renters had a life expectancy of 53.3 years, compared with the life expectancy of 48.6 years for male renters.
| Both Sexes | Male | Female | ||||
|---|---|---|---|---|---|---|
| LE | SE | LE | SE | LE | SE | |
| Sample size | 1,132,919 | 534,577 | 598,342 | |||
| Age 18 | ||||||
| Renter | 51.10 | 0.08 | 48.57 | 0.12 | 53.32 | 0.11 |
| Owner | 55.21 | 0.05 | 52.53 | 0.08 | 57.87 | 0.07 |
| Age 45 | ||||||
| Renter | 28.06 | 0.08 | 26.28 | 0.12 | 29.50 | 0.11 |
| Owner | 31.58 | 0.04 | 29.70 | 0.06 | 33.37 | 0.06 |
| Age 65 | ||||||
| Renter | 14.84 | 0.08 | 13.79 | 0.12 | 15.52 | 0.10 |
| Owner | 16.41 | 0.04 | 15.16 | 0.05 | 17.51 | 0.05 |
| NHW | NHB | Hispanics | ||||
| Sample size | 687,456 | 152,534 | 226,793 | |||
| Age 18 | ||||||
| Renter | 50.65 | 0.12 | 50.34 | 0.18 | 53.18 | 0.19 |
| Owner | 55.91 | 0.06 | 53.45 | 0.17 | 54.13 | 0.16 |
| Age 45 | ||||||
| Renter | 26.72 | 0.11 | 27.07 | 0.17 | 31.71 | 0.20 |
| Owner | 31.50 | 0.05 | 30.41 | 0.14 | 32.48 | 0.14 |
| Age 65 | ||||||
| Renter | 13.70 | 0.10 | 14.62 | 0.17 | 17.66 | 0.20 |
| Owner | 16.01 | 0.04 | 16.50 | 0.12 | 18.04 | 0.14 |
LE=Life expectancy, SE=standard error
3.5. Disparities in Life Expectancy by Socioeconomic Advantage/Disadvantage
At age 18, adults in the most-advantaged socioeconomic group had a life expectancy of 63.7 years, 17.5 years longer than the life expectancy of 46.2 years for the most-disadvantaged group (Figure 2). The corresponding group difference was 18.5 years for men and 18.2 years for women. Women in the most-advantaged socioeconomic group outlived men in the most-disadvantaged group by 23.5 years at age 18. Large life expectancy differences between the most-advantaged and most-disadvantaged socioeconomic groups can also be noted at ages 45 and 65.
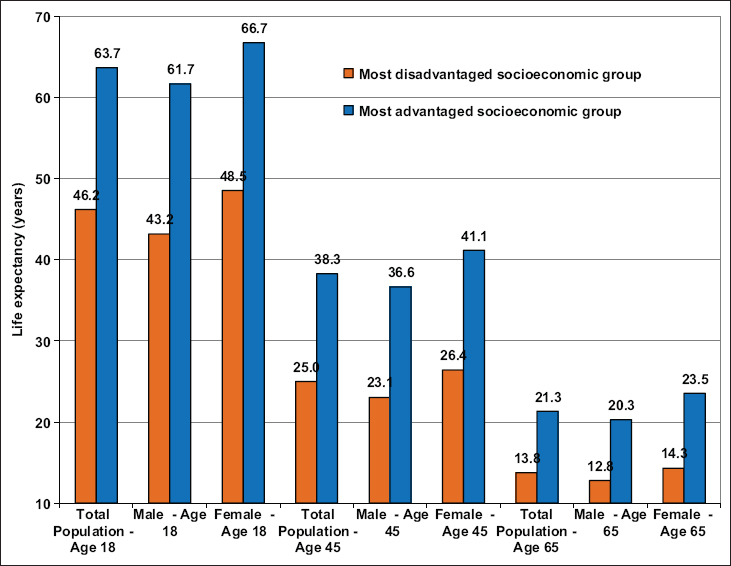
- Life Expectancy of the Most Disadvantaged and Most Advantaged Socioeconomic Groups by Age and Sex, United States, 1997-2014
- The most disadvantaged socioeconomic group consisted of adults with less than a high school education and family income below the poverty level. The most advantaged socioeconomic group consisted of adults with a master’s or higher degree and family income at or above 400% of the poverty threshold. Differences in life expectancy between the most advantaged and most disadvantaged socioeconomic groups across all sex and age groups were statistically significant at p<0.001
4. Discussion
In this large prospective study of 1,146,271 US adults using a mortality follow-up of 18 years, we found that adults with lower SES levels had substantially lower life expectancy, with a life expectancy gap of almost 18 years between the lowest and highest SES groups. Strikingly large socioeconomic disparities in life expectancy existed for both men and women and for non-Hispanics Whites, non-Hispanic Blacks, and Hispanics. A particularly novel feature of our study is that it provides recent life expectancy estimates for Americans according to four different individual-level SES measures of education, income, occupation, and housing tenure. Such a comprehensive range of socioeconomic inequalities in life expectancy has not been previously reported in the same study, to the best of our knowledge.
The findings of our study are consistent with those from previous studies of individual-level socioeconomic differentials in life expectancy.12, 15,17,18, 26,27 Rogot and colleagues found a difference in life expectancy at age 25 of 6 years for white men and 5 years for white women between the highest (master’s degree or higher) and lowest (less than high school) education levels, much smaller than the education differentials shown in our study.15 Consistent with our study, higher income was associated with higher life expectancy in the Rogot et al. study; however, the corresponding income/poverty differential in life expectancy in our study (11 years) was substantially greater than the difference of 5 years reported in their study.15 Although SES groups were slightly different, education and income/poverty differences (the highest SES group – the lowest SES group) in male and female life expectancy were much smaller in Canada (5 to 8 years)12 compared with 11 to 16 years noted in our US study. In a German study,26 differences in life expectancy at age 40 between the highest and lowest educated men and women were 6.3 and 2.3 years respectively, considerably smaller than the corresponding difference of 11 years for men and women in our study. Income differences in life expectancy were also smaller for Germany than for the US.26
Occupational differences in life expectancy in Germany were similar to those found in our study, with life expectancy of German men at age 40 ranging from 30 years for manual, unskilled workers to 39 years for those in professional and technical occupations.26 In England and Wales, the difference in life expectancy at birth between professional/managerial occupations and routine manual occupations (laborers, lorry drivers, and bar staff) was 6 years for men and 4 years for women.27 This is substantially smaller than the occupational difference in life expectancy noted for the US in our study. In the 1979-2011 US National Longitudinal Mortality Study, homeowners at age 20 had a life expectancy of 54.8 years, 3.4 years longer than the life expectancy of 51.4 years for renters.16 In our study, the difference in life expectancy at age 18 between homeowners and renters was 4.1 years.
Our study shows large socioeconomic differences in life expectancy among US men and women, which appeared to have increased over time in both absolute and relative terms when compared with similar estimates for comparative US populations in earlier time periods. Differences in material, psychosocial (stress, low control at work, home, or over life circumstances, social support, and social integration), lifestyle, and healthcare (health insurance, access to preventive health services, stage of disease at diagnosis, and treatment) factors may partly account for SES differences in life expectancy.1,9,28 Lower levels of education, income, occupational social class, and homeownership have been associated with higher prevalence of smoking, obesity, physical inactivity, heavy alcohol consumption, poor diet, and lower access to health services.1,6,29,30 Smoking rates have decreased more rapidly among those in higher SES groups, which has partly contributed to the widening disparities in life expectancy, all-cause mortality, and mortality from major causes of death such as cardiovascular disease (CVD) and cancer in the US.1,29,31 Indeed, smoking and obesity-related causes such as CVD, cancer, COPD, and diabetes and injuries may account for 50% to 75% of the life expectancy disparities between socioeconomic groups.1,9,29 However, a formal cause-of-death decomposition analysis is needed to better explain SES disparities in life expectancy shown here.
4.1. Limitations
This study has limitations. First, our study only contains NHIS samples eligible for linkage to the NDI. Excluding samples ineligible for linkage or unmatched records in the two databases may have affected life expectancy estimates. Second, our study did not conduct a life table decomposition analysis, which would have allowed us to partition socioeconomic disparities in life expectancy due to excess mortality in specific age groups and causes of death. Third, although our analysis of life expectancy does stratify by gender and race/ethnicity, it does not account for differences in other demographic characteristics such as marital status, nativity/immigrant status, geographic mobility, and place of residence. In our study, housing tenure was defined as a dichotomous variable, which does not distinguish renters who live in public or social housing or receive rental or housing assistance from a government program from those who do not receive any rental assistance. Renters receiving housing assistance or those living in public/social housing experience much higher risks of morbidity and mortality than homeowners and other renters.16,32,33 Fourth, since the NHIS excludes the institutionalized population, who may have higher levels of socioeconomic disadvantage, morbidity, and mortality, life expectancy for those at lower SES levels may have been overestimated, leading to possible underestimation of SES inequalities in life expectancy reported here. Fifth, all SES variables in the NHIS-NDI database were time-fixed at the baseline as of the survey date. Although education is fairly stable after age 25 for most adults over the life course, other measures of SES such as income/poverty status, occupation and employment status, and housing tenure may have changed over the long mortality follow-up of 18 years, potentially influencing the magnitude and patterns in life expectancy associated with these measures. Further studies are needed to evaluate the temporal robustness of socioeconomic patterns in life expectancy using longitudinal datasets with time-varying covariates and/or shorter mortality follow-ups.
5. Conclusions and Global Health Implications
Marked socioeconomic gradients in US life expectancy were found across all sex and racial/ethnic groups. Adults with lower education, higher poverty level, in manual occupations, and with rental housing had substantially lower life expectancy compared to their counterparts with higher socioeconomic position. Socioeconomic inequalities in life expectancy most likely reflect inequalities in material and social conditions as well as those in behavioral and healthcare factors.1,9,28 As life expectancy has improved around the globe, persistent or growing social inequalities in life expectancy are not only characteristic of high-income countries but also of the developing world.34 Social policies aimed at reducing disparities in the broader, more fundamental social determinants such as education, poverty, affordable housing, employment, work environment, labor market opportunities, and transportation, along with public health measures that target reductions in smoking, obesity, inadequate access to healthy foods, and improvements in access to health services have the potential to reduce health and life expectancy inequalities between high and low SES groups.1,9,10
Compliance with Ethical Standards
Conflicts of Interest: None.
Funding/Support: Hyunjung Lee was supported in part by an appointment to the Research Participation Program at the Health Resources & Services Administration - Office of Health Equity (HRSA-OHE), administered by the Oak Ridge Institute for Science and Education (ORISE) through an interagency agreement between the US Department of Energy and HRSA.
Ethical approval: The study was exempt from Institutional Review Board approval as it utilized a de-identified public use dataset.
Disclaimer: The views expressed in this article are those of the author and do not necessarily reflect the official policies of the US Department of Health and Human Services or the Health Resources and Services Administration.
References
- Inequalities in US life expectancy by area unemployment level. Scientifica 2016:8290435. DOI:10.1155/2016/8290435
- [Google Scholar]
- Widening disparities in infant mortality and life expectancy between Appalachia and the rest of the United States 1990-2013. Health Aff. 2017;36(8):1423-1432.
- [Google Scholar]
- Human Development reporting 2015. New York: United Nations; 2015.
- Social determinants of health in the United States:addressing major health inequality trends for the nation, 1935-2016. Int J MCH AIDS. 2017;6(2):139-164.
- [Google Scholar]
- (authors/editors) Health Equity Report 2017. In: Health Resources and Services Administration, Office of Health Equity. Rockville, Maryland: US Department of Health and Human Services; 2018.
- [Google Scholar]
- Widening rural-urban disparities in life expectancy U.S., 1969-2009. Am J Prev Med. 2014;46(2):e19-e29.
- [Google Scholar]
- Widening socioeconomic inequalities in US life expectancy 1980-2000. Int J Epidemiol. 2006;35(4):969-979.
- [Google Scholar]
- Area deprivation and inequalities in health and health care outcomes. Ann Intern Med. 2019;171(2):131-132.
- [Google Scholar]
- Tackling Health Inequalities:10 Years On London. UK: Health Inequalities Unit Department of Health; 2009.
- Socioeconomic disparities in life and health expectancy among the household population in Canada. Health Rep. 2020;31(1):3-14.
- [Google Scholar]
- Socioeconomic Remoteness and Sex Differences in Life Expectancy in New South Wales, Australia, 2001-2012:A Population-Based Study. BMJ Open. 2017;7(1):e013227. doi:10.1136/bmjopen-2016-013227
- [Google Scholar]
- Monitoring health inequalities:life expectancy and small area deprivation in New Zealand. Popul Health Metr. 2003;1:2. doi:10.1186/1478-7954-1-2
- [Google Scholar]
- Life expectancy by employment status income, and education in the National Longitudinal Mortality Study. Public Health Rep. 1992;107(4):457-461.
- [Google Scholar]
- 2020. Health Resources and Services Administration Office of Health Equity. Rockville, Maryland: US Department of Health and Human Services; https://www.hrsa.gov/sites/default/files/hrsa/health-equity/HRSA-health-equity-report.pdf
- The gap gets bigger:changes in mortality and life expectancy by education, 1981–2000. Health Aff. 2008;27(2):350-360.
- [Google Scholar]
- Differences in life expectancy due to race and educational differences are widening, and many may not catch up. Health Aff. 2012;31(8):1803-1813.
- [Google Scholar]
- Education reporting and classification on death certificates in the United States. National Center for Health Statistics. Vital Health Stat. 2010;2(151):1-14.
- [Google Scholar]
- IPUMS Health Surveys:National Health Interview Survey, Version 6.4 [dataset] 2019 doi:https://doi.org/10.18128/D070.V6.4
- Public-Use Linked Mortality File 2015
- It is better to be a fat ex-smoker than a thin smoker:findings from the 1997–2004 National Health Interview Survey? National Death Index linkage study. Tob Control. 2014;23(5):395-402.
- [Google Scholar]
- Dramatic increases in obesity and overweight prevalence and body mass index among ethnic-immigrant and social class groups in the United States, 1976-2008. J Community Health. 2011;36(1):94-110.
- [Google Scholar]
- Life Table Techniques and Their Applications. Orlando Fla: Academic Press; 1987.
- Demography:Measuring and Modeling Population Processes. Oxford, UK: Blackwell Publishers Ltd; 2001.
- Life Expectancy by education, income and occupation in Germany:estimations using the longitudinal survival method. Comparative Population Studies. 2015;40(4):399-436.
- [Google Scholar]
- A glossary of health inequalities. J Epidemiol Community Health. 2006;56(9):647-652.
- [Google Scholar]
- Socioeconomic and racial/ethnic disparities in cancer mortality incidence, and survival in the United States1950-2014:over six decades of changing patterns and widening Inequalities. J Environ Public Health 2017:2819372. doi:10.1155/2017/2819372
- [Google Scholar]
- United States 2018. Hyattsville MD: US Department of Health and Human Services; 2019.
- Widening socioeconomic and racial disparities in cardiovascular disease mortality in the United States, 1969-2013. Int J MCH AIDS. 2015;3(2):106-118.
- [Google Scholar]
- Differences in mortality by housing tenure and by car access from the OPCS Longitudinal Study. Population Trends. 1995;81:27-30.
- [Google Scholar]
- Global trends in lifespan inequality: 1950-2015. PLoS One. 2019;14(5):e0215742. doi:10.1371/journal.pone.0215742
- [Google Scholar]