Translate this page into:
Social Determinants of Health Among American Indians and Alaska Natives and Tribal Communities: Comparison with Other Major Racial and Ethnic Groups in the United States, 1990–2022

* Corresponding author: Gopal K Singh, Center for Global Health and Health Policy, Global Health and Education Projects, Inc., Riverdale, MD, United States. Tel: +1-301-443-0765 gsingh@mchandaids.org
-
Received: ,
Accepted: ,
How to cite this article: Singh GK, Lee H, Kim LH, Williams SD. Social determinants of health among american indians and alaska natives and tribal communities: Comparison with other major racial and ethnic groups in the United States, 1990-2022. Int J MCH AIDS. 2024;13:e010. doi: 10.25259/IJMA_10_2024
Abstract
Background and Objective
Limited research exists on health inequities between American Indians and Alaska Natives (AIANs), tribal communities, and other population groups in the United States. To address this gap in research, we conducted time-trend analyses of social determinants of health and disease outcomes for AIANs as a whole and specific tribal communities and compared them with those from the other major racial/ethnic groups.
Methods
We used data from the 1990–2022 National Vital Statistics System, 2015–2022 American Community Survey, and the 2018–2020 Behavioral Risk Factor Surveillance System to examine socioeconomic, health, disability, disease, and mortality patterns for AIANs.
Results
In 2021, life expectancy at birth was 70.6 years for AIANs, lower than that for Asian/Pacific Islanders (APIs) (84.1), Hispanics (78.8), and non-Hispanic Whites (76.3). All racial/ethnic groups experienced a decline in life expectancy between the pre-pandemic year of 2019 and the peak pandemic year of 2021. However, the impact of COVID-19 was the greatest for AIANs and Blacks whose life expectancy decreased by 6.3 and 5.8 years, respectively. The infant mortality rate for AIANs was 8.5 per 1,000 live births, 78% higher than the rate for non-Hispanic Whites. One in five AIANs assessed their physical and mental health as poor, at twice the rate of non-Hispanic Whites or the general population. COVID-19 was the leading cause of death among AIANs in 2021. Risks of mortality from alcohol-related problems, drug overdose, unintentional injuries, and homicide were higher among AIANs than the general population. AIANs had the highest overall disability, mental and ambulatory disability, health uninsurance, unemployment, and poverty rates, with differences in these indicators varying markedly across the AIAN tribes.
Conclusion and Global Health Implications
AIANs remain a disadvantaged racial/ethnic group in the US in many health and socioeconomic indicators, with poverty rates in many Native American tribal groups and reservations exceeding 40%.
Keywords
American Indians and Alaska Natives
Tribal Communities
Social Determinants
Life Expectancy
Mortality
Cause of Death
Infant Mortality
Disparities
Cancer Screening
Chronic Disease
INTRODUCTION
Although substantial progress has been made in improving the health and well-being of all Americans, health inequities between American Indians and Alaska Natives (AIANs), tribal communities, and other population groups have persisted. AIANs differ greatly from other major racial/ethnic groups in social determinants of health (SDOH) and related health outcomes.[1–4] They are more likely than other communities to live in less favorable socioeconomic and material living conditions that have historically placed them at a considerable disadvantage in health and socioeconomic attainment and in advancement toward health equity.[4] Available research shows that AIANs have the highest rates of low educational attainment and literacy, unemployment, poverty, suicide, homicide, mental distress, disability, and residence in adverse neighborhood conditions, and have one of the lowest life expectancies and high rates of premature mortality, infant and maternal mortality, injuries, and mortality from major chronic conditions.[1–4] Recent analyses show substantial disparities in disability, healthcare access, and socioeconomic conditions across the major tribes.[4]
Historical forced relocation, trauma, and exclusion that AIAN populations experience, including loss of land, interference with traditional language, cultural practices and identity, and social marginalization, impact their health outcomes and are reflected in their current disadvantaged health and social standing.[5] AIAN populations and communities have a unique burden from historical, intergenerational trauma that affects physical and mental health and welfare,[6] which has become a significant risk factor for AIANs resulting in severe health disparities. Many studies have found associations between historical trauma and severe health disparities among AIAN populations, not limited to physical health but also psychological and behavioral health.[4,7,8]
There is a dearth of high-quality health data on AIANs in the federal data systems due to their relatively small population size or racial/ethnic misclassification.[4] According to the 2020 Census, there were 3.7 million AIANs alone who did not identify with any other race.[9] In 2020, there were 9.7 million AIANs alone or in combination with one or more races, accounting for 2.9% of the total US population.[9] AIANs represent a culturally heterogeneous population consisting of 574 federally recognized tribes and more than 100 state recognized tribes.[4] Tribal-specific health and socioeconomic data are generally limited, except for those that are numerically large enough to be identified in decennial censuses and the American Community Survey (ACS).[4,10,11] In order to develop effective policy responses to reduce marked health inequities among the AIAN population and other racial/ethnic groups, a comprehensive examination of health and socioeconomic challenges faced by the Native American population, including tribal communities, is urgently needed.
To address the gaps in data and research and to monitor health and social inequalities among AIANs, this study provides the latest contemporary and time-trend analysis of SDOH and health and disease outcomes for AIANs as a whole and specific tribal communities and compares them with those from the other major racial/ethnic groups in the US.
METHODS
Temporal data from the 1990–2022 National Vital Statistics System (NVSS), the 2015–2019 American Community Survey (ACS) Public Use Microdata Sample, the 2022 ACS, and the 2018–2020 Behavioral Risk Factor Surveillance System (BRFSS) were used to examine socioeconomic, health, healthcare, disability, disease, and mortality patterns for AIANs compared to the other racial/ethnic groups and the general population.
National Vital Statistics System
The National Vital Statistics System (NVSS) has been the primary source for life expectancy and mortality analyses in the US by age, sex, race/ethnicity, cause of death, geographic area, and time period for over a century.[4,10,12,13] The NVSS consists of both mortality and natality data systems based on birth certificate and death certificate data for approximately 3.6 million births and 2.8 million deaths each year in the US.[4,10,12–15] National mortality data at the individual- and county-level were also linked to the census and ACS-based Area Deprivation Index (ADI) to examine socioeconomic disparities in mortality by race/ethnicity.[3,4,16–18] The ADI, a factor analytic index developed by Singh et al., is a powerful tool for monitoring population health inequalities across time and space. The 2014–2018 ADI consisted of 20 ACS-based socioeconomic indicators, which may be viewed as broadly representing educational opportunities, labor force skills, economic, and housing conditions in each county, community, or neighborhood.[16–18] The 2016–2019 linked birth/infant death data file, a component of the NVSS, was used to examine racial/ethnic disparities in age- and cause-specific infant mortality.[19]
American Community Survey
The ACS is the primary census database for producing socioeconomic, demographic, housing, labor force, disability, and health insurance characteristics of various population groups, including children, at the national, state, county, and local levels.[4,11,20] All ACS data are based on self-reports and obtained via mail-back questionnaires, telephone, and in-home personal interviews.[4,11,20] In this study, we used the pooled 2015–2019 ACS microdata sample and the 2022 ACS to analyze socioeconomic, health insurance, and disability data for racial/ethnic groups, including AIANs and 35 of the largest AIAN tribes.[20] Substantive and methodological details of the ACS are available in the census and other publications.[4,11,20]
Behavioral Risk Factor Surveillance System
The Behavioral Risk Factor Surveillance System (BRFSS) is an annual health-related telephone survey conducted by the Centers for Disease Control and Prevention (CDC).[21] The purpose of the survey is to provide national and state-specific prevalence estimates for a variety of adult health indicators, chronic health conditions, health-related risk behaviors, and use of preventive health services.[21–23] The annual BRFSS, with a sample of more than 400,000 adults, is representative of the noninstitutionalized adult population (≥ 18 years) of the US and is the largest continuously conducted health survey system in the world.[21–23]
Analytic Strategies
Three-year or five-year pooled data from NVSS, ACS, and BRFSS were used to derive robust and reliable health, morbidity, and mortality estimates for the AIAN population. Health and mortality patterns for AIANs were compared with those for non-Hispanic Whites, the total US population, and other major racial/ethnic minority groups. Life tables, age-adjusted mortality rates, prevalence, and risk ratios were used to examine health inequalities.[3,13] The Chi-square statistic was used to test the overall association between race/ethnicity and health and healthcare measures. The t-test was used to test the difference in prevalence, incidence, or mortality rates between two time periods or between AIANs and the other racial/ethnic groups. Statistical tests of significance were carried out at the 0.05 or 0.01 level.
RESULTS
Disparities in Social Determinants of Health
Racial/ethnic minorities, including AIANs, have historically been disadvantaged in terms of social and economic attainment and living conditions.[1–4] The 2022 ACS data in Figure 1 indicates two times higher poverty rates among AIANs (21.7%), Black/African Americans (21.3%), Hispanics (16.8%), and Native Hawaiians and other Pacific Islanders (17.6%) compared with non-Hispanic Whites (9.5%). AIANs have the lowest educational attainment and highest uninsured rate. In 2022, 16.8% of AIANs had a college degree compared with 57.4% of Asians and 39.5% of non-Hispanic Whites. In 2022, 18.5% of AIANs lacked health insurance compared with 5.5% of Asians and 5.3% of non-Hispanic Whites. Ethnic-minority groups, including AIANs, are less likely to own a house and more likely to speak a language other than English and less likely to have English language proficiency compared with non-Hispanic Whites [Figure 1].
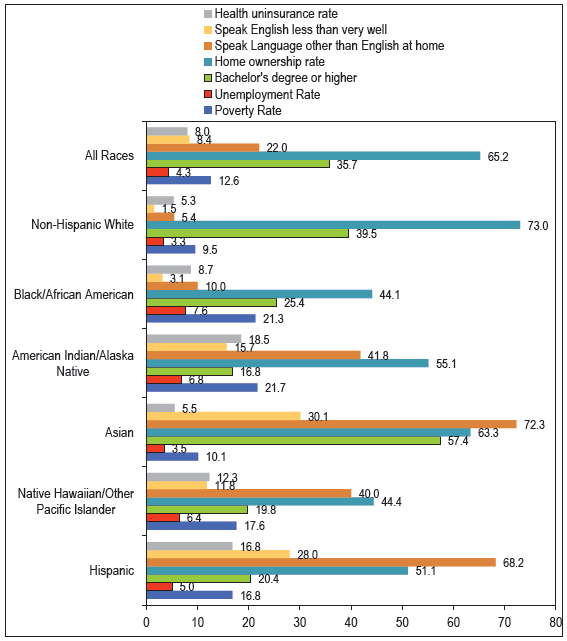
- Selected Sociodemographic Characteristics (%) by Race/Ethnicity, United States, 2022
-
Source: US Census Bureau. 2022 American Community Survey.
Geographic patterns in percentage of population with a college degree across all US counties and 28 counties with predominantly AIAN populations are shown in Figure 2. The Southeastern region of the US has the lowest percentage of adults with a college degree. Most of the 28 AIAN counties have significantly lower percentages of adults with a college degree. Geographic patterns in poverty rates across all US counties and the 28 AIAN counties are shown in Figure 3. Counties in the Southeastern and Southwestern regions experience higher poverty rates than those in the other regions of the US. Twenty-five of the 28 AIAN counties have a poverty rate of 21% or greater, with Todd County, South Dakota (55.5%), and Mellette County, South Dakota (52.8%), having the highest poverty rates.
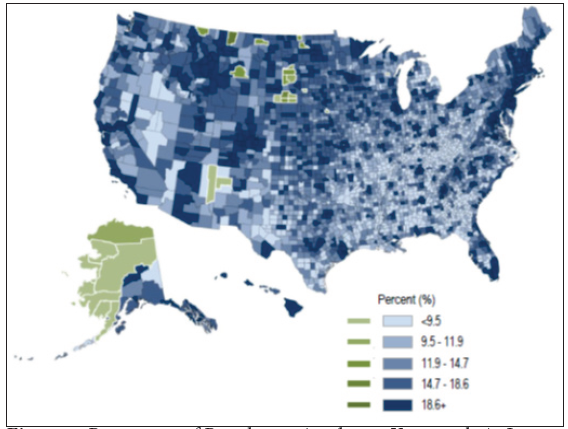
- Percentage of Population Aged ≥ 25 Years with At Least a College Degree, All 3,143 US Counties and 28 American Indian and Alaska Native (AI/AN) Counties, 2015–2019
-
Source: Data derived from the 2015–2019 American Community Survey.
- AI/AN counties (shown in green) are defined as those counties in which AI/ANs make up at least 50% of the population. These counties are located in Alaska, Arizona, Montana, New Mexico, North Dakota, South Dakota, and Wisconsin.
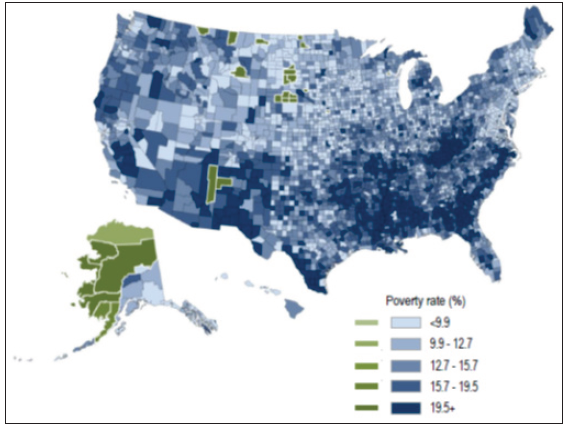
- Percentage of Population Below the Federal Poverty Level, All 3,143 US Counties and 28 American Indian and Alaska Native (AI/AN) Counties, 2015–2019
-
Source: Data derived from the 2015–2019 American Community Survey.
- AI/AN counties (shown in green) are defined as those counties in which AI/ANs make up at least 50% of the population. These counties are located in Alaska, Arizona, Montana, New Mexico, North Dakota, South Dakota, and Wisconsin.
Disparities in Life Expectancy and Decline in Life expectancy due to COVID-19 Pandemic
In 2021, life expectancy at birth was 70.6 years for AIANs, lower than that for APIs (84.1), Hispanics (78.8), non-Hispanic Whites (76.3), and slightly higher than the life expectancy of Black/African Americans (70.3) [Figures 4a and b]. Life expectancy for males ranged from a low of 66.5 years for Black/African Americans and 68.1 years for AIANs to a high of 81.6 years for APIs. Life expectancy for females ranged from a low of 73.4 years for AIANs and 74.2 years for Black/African Americans to a high of 86.4 years for APIs.
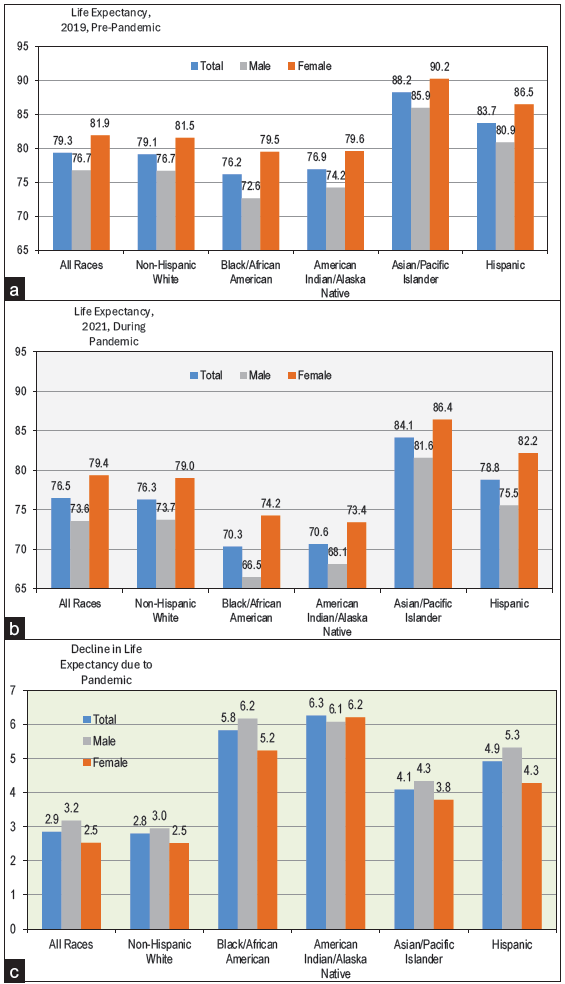
- Life Expectancy at Birth (Years) by Race/Ethnicity and Sex, United States, 2019 and 2021
-
Source: Data derived from the National Vital Statistics System.
The adverse impact of the COVID-19 pandemic can be measured by comparing life expectancies in the pre-pandemic period of 2019 and the peak pandemic year of 2021. All racial/ethnic groups experienced a substantial decline in life expectancy between 2019 and 2021. However, the impact of COVID-19 was the greatest for AIANs and Blacks whose life expectancy decreased by 6.3 and 5.8 years, respectively [Figure 4c].
Disparities in Infant, Neonatal, and Postneonatal Mortality
During 2016–2019, the infant mortality rate for AIANs was 8.49 per 1000 live births, significantly higher than the rates for non-Hispanic Whites (4.78), APIs (3.95), and Hispanics (4.99). Racial/ethnic patterns in neonatal mortality (during the first 27 days of life) were similar to those in overall infant mortality, with AIAN infants experiencing a lower risk of neonatal mortality than Black infants but higher risks of neonatal mortality than the other racial/ethnic groups. The postneonatal mortality rate (between 28 days and one year of age) for AIANs was the highest of all the major racial/ethnic groups [Figure 5].
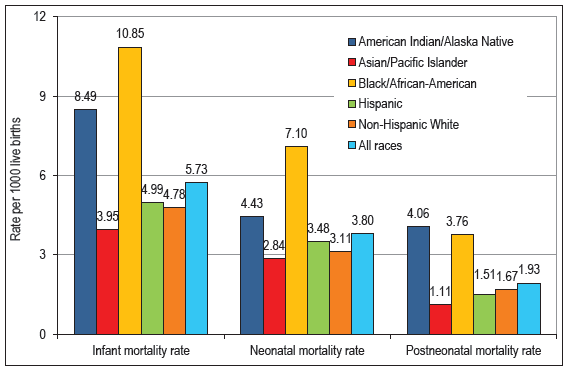
- Infant, Neonatal, and Postneonatal Mortality Rates per 1000 Live Births, By Race/Ethnicity, United States, 2016–2019 (N = 15,340,627 Live Births and 87,922 Infant Deaths)
-
Source: Data derived from the 2016–2019 Period Linked Birth and Infant Death Files.
Disparities in Infant Mortality by Cause of Death
During 2016–2019, AIAN infants experienced higher risks of mortality from three leading causes of death, including birth defects (congenital anomalies), sudden infant death syndrome (SIDS), and unintentional injuries compared with the other racial/ethnic groups [Figures 6a and b]. The rate of SIDS mortality for AIAN infants was 86.64 per 100,000 live births, 634% higher than the rate for API infants and 156% higher than the rate for non-Hispanic White infants. The rate of unintentional injury mortality for AIAN infants was 72.90 per 100,000 live births, 483% higher than the rate for API infants and 132% higher than the rate for non-Hispanic White infants [Figure 6b]. AIAN infants also experienced significantly higher mortality risks from maternal complications and perinatal conditions than non-Hispanic Whites, Hispanics, and APIs.
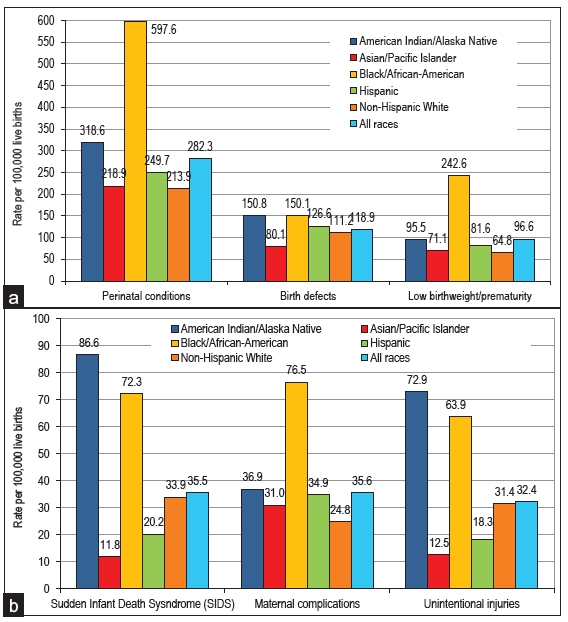
- Infant Mortality from Selected Major Causes of Death, By Race/Ethnicity, United States, 2016–2019 (N = 15,340,627 Live Births and 43,302 Infant Deaths from Perinatal Conditions, 18,233 Infant Deaths from Birth Defects, 14,826 Infant Deaths from Low Birthweight/Prematurity, 5440 Infant Deaths from SIDS, 5464 Infant Deaths from Maternal Complications, and 4963 Infant Deaths from Unintentional Injuries)
-
Source: Data derived from the 2016–2019 Period Linked Birth and Infant Death Files.
Disparities in Infant Mortality by Race/Ethnicity and ADI
During 2016–2020, infant mortality rates were generally higher in communities with higher deprivation levels [Figure 7]. This pattern held for AIANs and other racial/ethnic groups. The infant mortality rate for AIAN infants was 5.8 per 1000 live births in the most deprived counties [Figure 7]. This rate was 4.3 times higher than the infant mortality rate for AIANs in the least deprived counties (5.8 vs. 1.4).
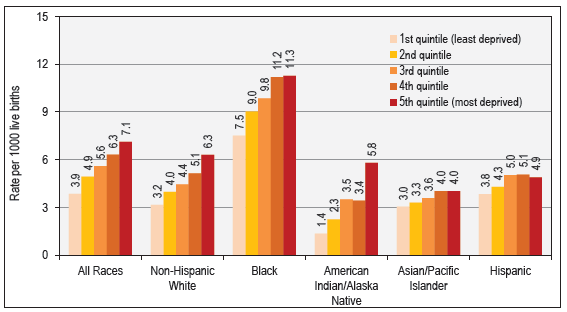
- Infant Mortality by Race/Ethnicity and Area Deprivation Index, United States, 2016–2020
-
Source: Data derived from the 2016–2020 National Vital Statistics System.
Disparities in Child and Adolescent Mortality by Race/Ethnicity and ADI
During 2016–2020, child and adolescent mortality rates were generally higher in areas with higher deprivation levels for AIANs and other racial/ethnic groups [Figure 8]. The child/adolescent mortality rate for AIANs was 41.9 deaths per 10,000 population in the most deprived counties; this rate was five times higher than the mortality rate for AIANs in the least deprived counties (41.9 vs. 8.5).
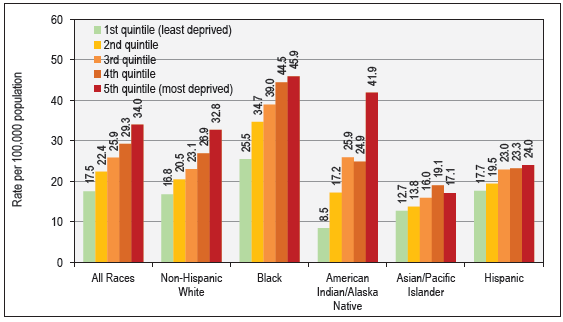
- Child and Adolescent (1–19 Years) Mortality by Race/Ethnicity and Area Deprivation Index, United States, 2016–2020
-
Source: Data derived from the 2016–2020 National Vital Statistics System.
Disparities in Mortality from Leading Causes of Death, 2021
COVID-19, cardiovascular disease (CVD), including heart disease and stroke, cancer, unintentional injuries, chronic liver disease and cirrhosis, diabetes, chronic obstructive pulmonary disease (COPD), suicide, nephritis/kidney disease, and Alzheimer’s disease were the top ten leading causes of death among AIANs and accounted for 78.4% of all deaths among them in 2021 [Table 1]. All-cause mortality and mortality from CVD and cancer were significantly lower among AIANs compared with non-Hispanic Whites and the total US population. COVID-19 was the leading cause of death among AIANs with 5009 deaths in 2021. The COVID-19 mortality rate for AIANs (133.9 deaths per 100,000 population) was 43% higher than the rate for non-Hispanic Whites (93.5) and 29% higher than the rate for the total US population (104.1). The risk of diabetes mortality among AIANs was 65% higher than that for non-Hispanic Whites. Liver cirrhosis mortality among AIANs was at least 3.2 times higher than that for non-Hispanic Whites and the total population. Alcohol-related mortality was almost four times higher among AIANs than non-Hispanic Whites and the total US population. The homicide rate for AIANs was 2.5 times higher than the rate for non-Hispanic Whites [Table 1].
| AIAN | AIAN | Non-Hispanic Whites | Total Population | AIAN | NHW | US | |||
|---|---|---|---|---|---|---|---|---|---|
| Deaths | Death rate | Deaths | Death rate | Deaths | Death rate | Percent | Percent | Percent | |
| All Causes of Death | 28,941 | 787.49 | 2,548,809 | 893.91 | 3,464,231 | 879.68 | 100.0 | 100.0 | 100.0 |
| Major Cardiovascular Diseases (CVD) | 5280 | 155.24 | 696,709 | 235.65 | 925,923 | 231.79 | 18.2 | 27.3 | 26.7 |
| Heart Disease | 4019 | 116.66 | 531,162 | 179.78 | 695,547 | 173.78 | 13.9 | 20.8 | 20.1 |
| Stroke | 868 | 26.90 | 117,809 | 39.83 | 162,890 | 41.14 | 3.0 | 4.6 | 4.7 |
| COVID-19 | 5009 | 133.88 | 271,253 | 93.51 | 416,893 | 104.12 | 17.3 | 10.6 | 12.0 |
| All Cancers Combined | 3394 | 93.86 | 462,601 | 153.74 | 605,213 | 146.55 | 11.7 | 18.1 | 17.5 |
| Lung Cancer | 701 | 19.79 | 109,126 | 35.07 | 134,592 | 31.75 | 2.4 | 4.3 | 3.9 |
| Colorectal Cancer | 349 | 9.63 | 39,425 | 13.56 | 54,121 | 13.36 | 1.2 | 1.5 | 1.6 |
| Breast Cancer | 214 | 10.49 | 30,760 | 19.76 | 42,310 | 19.37 | 0.7 | 1.2 | 1.2 |
| Prostate Cancer | 143 | 10.46 | 23,941 | 18.43 | 32,563 | 18.96 | 0.5 | 0.9 | 0.9 |
| Cervical Cancer | 58 | 2.83 | 2680 | 2.18 | 4366 | 2.27 | 0.2 | 0.1 | 0.1 |
| Liver & IBD Cancer | 289 | 7.21 | 19,016 | 6.11 | 28,719 | 6.68 | 1.0 | 0.7 | 0.8 |
| Stomach Cancer | 105 | 2.90 | 5991 | 2.03 | 10,894 | 2.67 | 0.4 | 0.2 | 0.3 |
| Accidents and Adverse Effects | 3235 | 78.15 | 153,897 | 69.96 | 224,935 | 64.71 | 11.2 | 6.0 | 6.5 |
| Chronic Liver Disease and Cirrhosis | 1993 | 48.19 | 39,824 | 15.21 | 56,585 | 14.47 | 6.9 | 1.6 | 1.6 |
| Diabetes Mellitus | 1365 | 36.93 | 65,789 | 22.36 | 103,294 | 25.41 | 4.7 | 2.6 | 3.0 |
| COPD | 874 | 25.61 | 122,054 | 39.92 | 142,342 | 34.71 | 3.0 | 4.8 | 4.1 |
| Suicide | 733 | 16.80 | 36,681 | 17.44 | 48,183 | 14.09 | 2.5 | 1.4 | 1.4 |
| Pneumonia and Influenza | 356 | 10.25 | 30,673 | 10.43 | 41,917 | 10.53 | 1.2 | 1.2 | 1.2 |
| Alzheimer’s disease | 408 | 15.24 | 96,522 | 32.62 | 119,399 | 30.96 | 1.4 | 3.8 | 3.4 |
| Nephritis and Kidney Diseases | 426 | 12.19 | 36,444 | 12.28 | 54,358 | 13.55 | 1.5 | 1.4 | 1.6 |
| Septicemia | 312 | 8.24 | 29,455 | 10.02 | 41,281 | 10.22 | 1.1 | 1.2 | 1.2 |
| Homicide | 356 | 8.33 | 6215 | 3.28 | 26,031 | 8.17 | 1.2 | 0.2 | 0.8 |
| Viral Hepatitis | 66 | 1.54 | 2217 | 0.78 | 3589 | 0.85 | 0.2 | 0.1 | 0.1 |
| Drug Overdose Mortality | 1588 | 37.47 | 73,225 | 38.17 | 111,219 | 33.64 | 5.5 | 2.9 | 3.2 |
| Alcohol-Related Causes | 2319 | 56.00 | 38,117 | 15.56 | 54,258 | 14.42 | 8.0 | 1.5 | 1.6 |
| Firearm Injuries | 531 | 12.32 | 26,054 | 12.33 | 48,830 | 14.65 | 1.8 | 1.0 | 1.4 |
| Firearm Injuries (Rural) | 269 | 22.19 | 6348 | 17.81 | 8402 | 18.24 | 0.9 | 0.2 | 0.2 |
Death rates are directly standardized to the 2000 US standard population. IBD = Intrahepatic bile duct. COPD = Chronic obstructive pulmonary diseases.
Source: CDC/NCHS. National Vital Statistics System. 2021 Mortality Detail File.
Trends and Disparities in Working-Age Mortality, 1990–2022
Working-age mortality between ages 15 and 64 years is sensitive to social and economic fluctuations and is greatly influenced by deaths due to suicide, homicide, injuries, drug overdoses, alcohol-related causes, CVD, and cancer.[18] While working-age mortality rates declined consistently between 1990 and 2010, there was an upward trend in mortality between 2010 and 2021 for all AIANs and rural AIANs as well as for non-Hispanic Whites and the total US population [Figure 9]. The increase in working-age mortality between 2010 and 2021 was much more rapid for rural AIANs and for all AIANs than for non-Hispanic Whites and the total population. In 2021, rural AIANs were 2.3 times more likely to die prematurely in working ages than the total population.
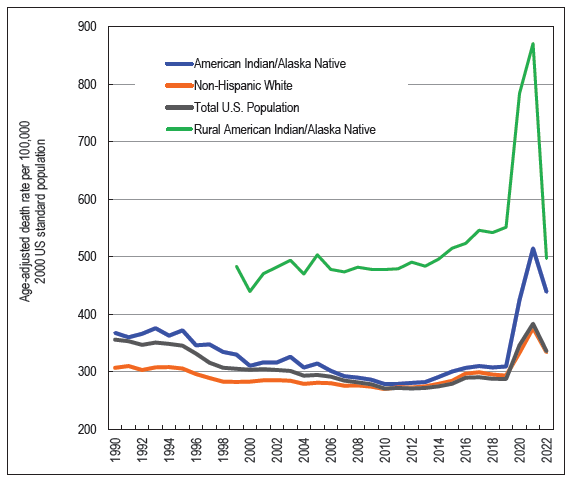
- Trends in Working-Age (15–64) Mortality among American Indians and Alaska Natives, Non-Hispanic Whites, and the Total US Population, 1990–2022
-
Source: Data derived from the National Vital Statistics System. Data for 2022 are provisional.
Working-age mortality varied greatly in relation to ADI [Figure 10]. During 2016–2020, AIANs living in the most deprived counties had 3.6 times higher premature mortality than AIANs in the least deprived counties (478.3 deaths vs. 132.2 deaths per 100,000 population). Similar socioeconomic patterns in premature mortality can be found for the other racial/ethnic groups, including rural AIANs.
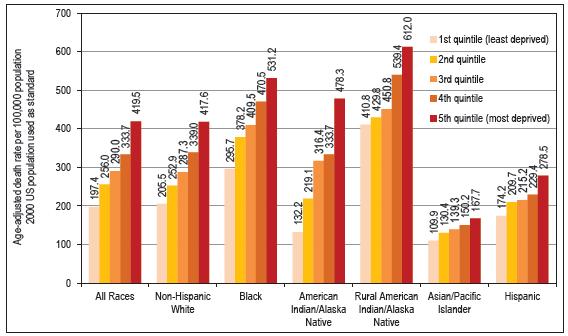
- Working-Age (15–64 Years) Mortality by Race/Ethnicity and Area Deprivation Index, United States, 2016–2020
-
Source: Data derived from the National Vital Statistics System.
Disparities in Disability, Chronic Conditions, Health Insurance, and Risk Factors by Race/Ethnicity and Native American Tribe
The overall disability rate was highest among AIANs [Table 2]. Approximately 17.7% of the AIAN population reported a disability during 2015–2019, compared with 14.5% of non-Hispanic Whites, 14.6% of African Americans, 7.3% of APIs, 9.2% of Hispanics, and 13.1% of the total US population. AIANs also reported significantly higher mental and ambulatory disability rates than other racial/ethnic groups.
| Race/Ethnicity and | Total | Hearing | Vision | Cognitive | Ambulatory | Selfcare | Independent Living |
|---|---|---|---|---|---|---|---|
| Disability | Disability | Disability | Disability Rate | Disability Rate | Difficulty Rate | Difficulty Rate | |
| American Indian and Alaska Native Tribe | Rate | Rate | Rate | Population aged 5+ | Population aged 5+ | Population aged 5+ | Population aged 15+ |
| Total population | 13.12 | 3.67 | 2.44 | 5.46 | 7.31 | 3.00 | 6.09 |
| Non-Hispanic White | 14.52 | 4.62 | 2.46 | 5.64 | 8.05 | 3.21 | 6.47 |
| Black/African American | 14.58 | 2.24 | 3.11 | 6.78 | 8.86 | 3.71 | 7.25 |
| Asian and Pacific Islander | 7.27 | 2.03 | 1.45 | 2.91 | 3.87 | 1.87 | 3.97 |
| Hispanic | 9.18 | 2.09 | 2.19 | 4.40 | 4.77 | 2.19 | 4.38 |
| American Indian and Alaska Native (AIAN) | 17.67 | 4.93 | 3.95 | 7.91 | 9.99 | 3.61 | 7.88 |
| Apache | 20.19 | 6.00 | 4.87 | 8.53 | 12.24 | 3.77 | 7.96 |
| Blackfeet | 21.88 | 5.51 | 4.55 | 12.35 | 12.51 | 4.84 | 8.88 |
| Cherokee | 24.00 | 6.97 | 5.37 | 10.23 | 14.58 | 4.98 | 9.93 |
| Cheyenne | 17.03 | 4.06 | 4.17 | 10.18 | 11.54 | 3.27 | 7.04 |
| Chickasaw | 15.52 | 4.77 | 3.19 | 6.95 | 8.44 | 3.16 | 5.95 |
| Chippewa | 18.30 | 4.54 | 3.27 | 9.05 | 9.52 | 3.75 | 7.84 |
| Choctaw | 18.30 | 4.81 | 4.10 | 7.87 | 9.88 | 3.10 | 7.98 |
| Comanche | 17.35 | 7.22 | 3.98 | 6.29 | 8.09 | 3.26 | 5.60 |
| Creek | 16.75 | 4.19 | 3.00 | 6.11 | 10.09 | 2.60 | 6.52 |
| Crow | 12.08 | 3.05 | 1.98 | 4.57 | 7.19 | 1.96 | 5.12 |
| Hopi | 12.82 | 4.11 | 4.10 | 6.19 | 6.59 | 2.83 | 7.67 |
| Iroquois | 18.90 | 5.27 | 2.76 | 6.94 | 11.35 | 2.68 | 8.36 |
| Lumbee | 16.52 | 3.95 | 3.42 | 7.02 | 11.16 | 4.12 | 7.56 |
| Mexican American Indian | 10.68 | 2.54 | 2.29 | 5.21 | 5.04 | 2.12 | 4.27 |
| Navajo | 13.78 | 4.85 | 3.96 | 6.06 | 7.15 | 2.88 | 6.61 |
| Pima | 13.71 | 3.20 | 3.67 | 5.41 | 8.52 | 3.29 | 7.53 |
| Potawatomi | 17.47 | 4.22 | 3.23 | 5.85 | 9.57 | 3.82 | 6.77 |
| Pueblo | 15.33 | 5.05 | 3.98 | 6.00 | 7.51 | 2.90 | 6.54 |
| Puget Sound Salish | 13.83 | 4.72 | 2.58 | 6.03 | 7.53 | 3.30 | 6.88 |
| Seminole | 16.26 | 4.92 | 3.06 | 7.43 | 10.91 | 2.61 | 6.60 |
| Sioux | 15.97 | 4.13 | 3.21 | 7.48 | 9.28 | 3.25 | 7.18 |
| South American Indian | 14.35 | 1.73 | 3.10 | 7.08 | 7.98 | 2.97 | 5.72 |
| Tohono O’odham | 15.62 | 4.13 | 4.18 | 6.91 | 8.84 | 3.20 | 8.13 |
| Yaqui | 18.16 | 5.04 | 3.74 | 9.69 | 10.28 | 4.16 | 9.76 |
| Other specified AI tribes alone | 16.55 | 4.57 | 3.00 | 7.06 | 9.49 | 3.16 | 7.65 |
| All other specified AI tribe combinations | 18.09 | 4.83 | 3.84 | 8.29 | 10.03 | 3.59 | 8.11 |
| American Indian, tribe not specified | 18.24 | 4.61 | 4.83 | 7.96 | 10.81 | 4.31 | 7.63 |
| Alaskan Athabascan | 19.96 | 7.04 | 3.49 | 8.49 | 10.04 | 3.63 | 8.47 |
| Tlingit-Haida | 19.68 | 7.60 | 4.06 | 7.57 | 12.59 | 4.24 | 8.96 |
| Inupiat | 13.93 | 6.84 | 3.89 | 4.81 | 6.82 | 1.92 | 6.32 |
| Yup’ik | 13.82 | 6.98 | 3.23 | 5.44 | 6.25 | 1.51 | 5.11 |
| Aleut | 18.28 | 6.95 | 4.34 | 8.27 | 9.17 | 2.92 | 7.46 |
| Other Alaska Native | 18.42 | 6.07 | 3.70 | 8.88 | 7.89 | 3.71 | 9.12 |
| Other AIAN specified | 25.22 | 6.91 | 5.49 | 12.50 | 14.43 | 5.26 | 12.34 |
| AIAN, not specified | 19.27 | 4.46 | 4.41 | 9.12 | 11.04 | 4.38 | 9.12 |
Source: Data derived from the 2015–2019 American Community Survey, AI: American Indian.
Disability rates varied among AIAN tribes. Cherokee (24.0%), Blackfeet (21.9%), and Apache (20.2%) had the highest disability rates, while Crow (12.1%), Hopi (12.8%), and Pima (13.7%) had the lowest disability rates. Blackfeet (12.4%), Cherokee (10.2%), and Cheyenne (10.2%) had the highest mental disability rates and Cherokee (14.6%), Tlingit-Haida (12.6%), and Blackfeet (12.5%) had the highest ambulatory disability rates.
During 2015–2019, among the AIAN tribes, Seminole (31.7%), Crow (30.6), Comanche (29.6%), Pima (28.1%), and Blackfeet (26.2%) had the highest uninsured rates, while South American Indians (12.5%), Lumbee (13.5%), and Iroquois (14.1%) had the lowest rates of uninsured [Table 3].
| Race/Ethnicity and | Home | Median | Unemp- | White | Without | With at least | Health | ||
|---|---|---|---|---|---|---|---|---|---|
| Ownership | Household | Poverty | loyment | Collar | Service | High School | Bachelor’s | Uninsurance | |
| American Indian and Alaska Native Tribe | Rate (%) | Income ($) | Rate (%) | Rate (%) | Occupation (%) | Occupation (%) |
Diploma Pop 25+ (%) |
Degree Pop 25+ (%) |
Rate (%) |
| Total population | 63.66 | 62,667 | 13.65 | 5.40 | 58.54 | 18.70 | 12.03 | 32.03 | 9.21 |
| Non-Hispanic White | 71.66 | 68,690 | 9.80 | 4.35 | 63.54 | 15.67 | 7.16 | 35.71 | 6.21 |
| Black/African American | 41.40 | 41,820 | 23.31 | 9.50 | 50.09 | 25.43 | 14.03 | 21.58 | 11.12 |
| Asian and Pacific Islander | 58.82 | 86,642 | 11.35 | 4.29 | 69.01 | 17.32 | 12.80 | 53.21 | 6.91 |
| Hispanic | 46.79 | 51,573 | 20.03 | 6.12 | 41.90 | 25.52 | 31.41 | 16.30 | 18.53 |
| American Indian and Alaska Native (AIAN) | 54.39 | 43,527 | 25.04 | 10.26 | 45.53 | 25.39 | 19.53 | 15.22 | 19.84 |
| Apache | 49.34 | 40,810 | 30.11 | 15.35 | 45.56 | 27.68 | 20.77 | 11.39 | 14.22 |
| Blackfeet | 53.94 | 32,205 | 29.35 | 11.24 | 47.91 | 29.05 | 14.42 | 19.15 | 26.24 |
| Cherokee | 60.74 | 47,232 | 20.97 | 7.71 | 51.33 | 21.27 | 14.10 | 19.66 | 18.91 |
| Cheyenne | 49.45 | 43,321 | 26.67 | 13.49 | 48.30 | 29.27 | 13.12 | 19.93 | 23.38 |
| Chickasaw | 68.66 | 60,609 | 14.01 | 4.80 | 56.02 | 21.30 | 9.62 | 23.27 | 21.39 |
| Chippewa | 55.07 | 42,501 | 25.33 | 11.21 | 45.00 | 28.09 | 14.69 | 14.66 | 17.10 |
| Choctaw | 63.61 | 52,730 | 17.22 | 7.11 | 50.38 | 21.66 | 13.25 | 21.92 | 21.84 |
| Comanche | 50.21 | 48,487 | 23.49 | 10.72 | 49.41 | 19.46 | 10.16 | 21.67 | 29.61 |
| Creek | 63.78 | 49,186 | 17.98 | 7.64 | 52.28 | 21.42 | 11.27 | 20.67 | 20.48 |
| Crow | 46.84 | 43,321 | 26.63 | 18.51 | 49.76 | 22.69 | 10.01 | 13.81 | 30.64 |
| Hopi | 54.38 | 43,344 | 28.54 | 8.53 | 51.98 | 26.54 | 10.33 | 11.30 | 16.15 |
| Iroquois | 54.96 | 43,321 | 21.20 | 9.26 | 51.88 | 20.88 | 12.72 | 19.53 | 14.08 |
| Lumbee | 67.78 | 42,931 | 23.85 | 6.38 | 46.56 | 19.36 | 23.26 | 16.63 | 13.46 |
| Mexican American Indian | 43.94 | 49,566 | 20.44 | 6.49 | 33.41 | 26.36 | 44.02 | 12.92 | 25.35 |
| Navajo | 57.57 | 36,700 | 32.03 | 11.37 | 43.68 | 26.28 | 19.64 | 10.90 | 22.16 |
| Pima | 45.52 | 33,747 | 35.02 | 14.29 | 38.76 | 35.37 | 27.37 | 9.33 | 28.12 |
| Potawatomi | 66.67 | 56,893 | 17.18 | 8.65 | 54.08 | 19.12 | 10.69 | 22.04 | 17.44 |
| Pueblo | 62.59 | 42,938 | 25.55 | 11.00 | 51.67 | 24.83 | 14.66 | 15.82 | 22.89 |
| Puget Sound Salish | 56.77 | 52,835 | 18.66 | 11.96 | 52.36 | 26.98 | 16.08 | 12.82 | 18.78 |
| Seminole | 52.48 | 50,094 | 22.61 | 8.73 | 53.78 | 22.61 | 12.44 | 16.16 | 31.73 |
| Sioux | 41.52 | 35,651 | 40.87 | 15.35 | 43.55 | 29.52 | 18.13 | 12.96 | 25.02 |
| South American Indian | 41.63 | 51,573 | 18.23 | 7.25 | 46.69 | 26.06 | 19.92 | 26.00 | 12.52 |
| Tohono O’odham | 36.01 | 30,253 | 40.60 | 19.45 | 35.66 | 34.16 | 27.97 | 5.19 | 20.05 |
| Yaqui | 47.85 | 47,477 | 25.65 | 10.75 | 43.63 | 31.44 | 22.63 | 11.08 | 18.02 |
| Other specified AI tribes alone | 53.68 | 42,817 | 23.86 | 10.56 | 45.73 | 25.96 | 18.35 | 15.43 | 19.45 |
| All other specified AI tribe combinations | 54.06 | 45,962 | 22.79 | 11.10 | 47.57 | 25.90 | 15.19 | 15.10 | 17.96 |
| American Indian, tribe not specified | 53.97 | 50,452 | 19.44 | 7.40 | 46.59 | 26.56 | 20.64 | 18.75 | 15.65 |
| Alaskan Athabascan | 62.45 | 45,952 | 18.97 | 16.79 | 44.51 | 26.82 | 17.36 | 14.71 | 23.97 |
| Tlingit-Haida | 57.83 | 45,348 | 17.66 | 8.91 | 54.53 | 22.51 | 9.34 | 15.88 | 20.76 |
| Inupiat | 57.52 | 53,017 | 26.86 | 18.27 | 47.41 | 20.87 | 18.28 | 10.95 | 24.67 |
| Yup’ik | 61.09 | 45,085 | 28.85 | 22.46 | 44.12 | 24.89 | 21.08 | 4.24 | 21.30 |
| Aleut | 54.68 | 57,761 | 18.55 | 11.79 | 42.82 | 22.82 | 12.05 | 17.07 | 24.02 |
| Other Alaska Native | 52.44 | 48,776 | 28.53 | 13.63 | 46.07 | 24.66 | 20.13 | 9.19 | 25.50 |
| Other AIAN specified | 45.72 | 38,493 | 24.76 | 16.12 | 43.41 | 26.08 | 17.72 | 13.18 | 20.88 |
| AIAN, not specified | 47.64 | 42,138 | 24.82 | 8.97 | 39.93 | 27.08 | 27.73 | 13.73 | 17.55 |
Source: Data derived from the 2015–2019 American Community Survey, AI: American Indian.
During 2015–2019, poverty, unemployment, and education varied considerably across the AIAN tribes [Table 3]. The poverty rate was highest among Sioux (40.9%), followed by Tohono O’odham (40.6%), Pima (35.0%), Navajo (32.0%), Apache (30.1%), Blackfeet (29.4%), Yup’ik (28.9%), and Hopi (28.5%). Several tribes reported high rates of unemployment, such as Yup’ik (22.5%), Tohono O’odham (19.5%), Crow (18.5%), Inupiat (18.3%), and Alaskan Athabascan (16.8%).
Both computer and internet use have had measurable effects not only on individual empowerment, educational attainment, economic growth, and community development, but also on accessing healthcare, health-related information, and health education and promotions efforts, and are increasingly being recognized as an important SDOH.[1,24–26] During 2015–2019, 71.4% of AIANs reported having access to broadband (high-speed) internet service compared with 89.4% of APIs, 84.2% of non-Hispanic Whites, 77.4% of African Americans, and 77.9% of Hispanics [Table 4]. AIANs reported the lowest rate of computer (including smartphone) use (82.7%) compared with 95.5% of APIs and 90.9% of non-Hispanic Whites. There were significant disparities in broadband internet and computer access among AIAN tribes. Hopi (79.6%), Iroquois (78.0%), and Chippewa (77.8%) had the highest rates of broadband access, while Yup’ik (49.3%), Tohono O’odham (50.3%), and Inupiat (60.3%) reported the lowest rates of broadband access. Navajo (66.5%), Tohono O’odham (73.9%), and Pueblo (75.3%) reported the lowest rates of computer use.
| Race/Ethnicity and | Broadband | 95% | 95% | Computer | 95% | 95% |
|---|---|---|---|---|---|---|
| Internet | Confidence | Confidence | Use | Confidence | Confidence | |
| American Indian and Alaska Native Tribe | (%) | Interval (lower) | Interval (upper) | (%) | Interval (lower) | Interval (upper) |
| Total population | 82.83 | 82.80 | 82.80 | 90.32 | 90.20 | 90.40 |
| Non-Hispanic White | 84.15 | 84.20 | 84.20 | 90.86 | 90.80 | 91.00 |
| Black/African American | 77.35 | 77.20 | 77.40 | 85.81 | 85.80 | 86.00 |
| Asian and Pacific Islander | 89.41 | 89.20 | 89.60 | 95.52 | 95.40 | 95.60 |
| Hispanic | 77.90 | 77.80 | 78.00 | 89.85 | 89.80 | 90.00 |
| American Indian and Alaska Native (AIAN) | 71.43 | 70.80 | 72.00 | 82.68 | 82.40 | 83.00 |
| Apache | 75.93 | 72.80 | 79.00 | 81.10 | 79.00 | 83.20 |
| Blackfeet | 67.06 | 62.20 | 71.80 | 79.84 | 76.00 | 83.60 |
| Cherokee | 70.29 | 69.00 | 71.60 | 84.83 | 84.00 | 85.80 |
| Cheyenne | 73.39 | 63.00 | 83.80 | 82.79 | 77.60 | 88.00 |
| Chickasaw | 72.88 | 68.20 | 77.60 | 92.54 | 90.00 | 95.00 |
| Chippewa | 77.80 | 75.80 | 79.80 | 85.44 | 84.00 | 86.80 |
| Choctaw | 70.17 | 67.80 | 72.60 | 87.30 | 86.00 | 88.60 |
| Comanche | 63.59 | 55.60 | 71.40 | 88.91 | 84.40 | 93.40 |
| Creek | 66.92 | 63.00 | 70.80 | 87.34 | 85.20 | 89.40 |
| Crow | 74.76 | 64.60 | 85.00 | 85.18 | 79.40 | 91.00 |
| Hopi | 79.58 | 73.00 | 86.20 | 80.12 | 75.60 | 84.60 |
| Iroquois | 78.01 | 75.00 | 81.00 | 85.36 | 83.00 | 87.60 |
| Lumbee | 73.95 | 71.80 | 76.20 | 79.27 | 77.40 | 81.20 |
| Mexican American Indian | 72.44 | 70.00 | 74.80 | 88.96 | 87.20 | 90.60 |
| Navajo | 63.55 | 61.40 | 65.60 | 66.47 | 65.40 | 67.60 |
| Pima | 70.57 | 64.20 | 77.00 | 78.09 | 74.20 | 82.00 |
| Potawatomi | 73.85 | 69.80 | 77.80 | 90.41 | 87.60 | 93.20 |
| Pueblo | 68.33 | 64.00 | 72.60 | 75.29 | 73.20 | 77.20 |
| Puget Sound Salish | 73.35 | 67.20 | 79.40 | 88.07 | 84.80 | 91.40 |
| Seminole | 73.99 | 68.40 | 79.60 | 85.17 | 81.00 | 89.20 |
| Sioux | 74.58 | 72.00 | 77.20 | 77.72 | 75.80 | 79.60 |
| South American Indian | 84.24 | 81.20 | 87.40 | 94.92 | 93.20 | 96.60 |
| Tohono O’odham | 50.32 | 42.80 | 57.80 | 73.85 | 69.00 | 78.60 |
| Yaqui | 69.19 | 63.60 | 74.60 | 88.88 | 85.80 | 92.00 |
| Other specified AI tribes alone | 72.19 | 70.20 | 74.20 | 86.19 | 84.80 | 87.60 |
| All other specified AI tribe combinations | 73.65 | 72.20 | 75.20 | 87.12 | 86.20 | 88.00 |
| American Indian, tribe not specified | 76.07 | 72.80 | 79.20 | 88.36 | 86.40 | 90.40 |
| Alaskan Athabascan | 73.99 | 67.80 | 80.20 | 81.79 | 78.20 | 85.40 |
| Tlingit-Haida | 66.83 | 58.80 | 75.00 | 88.37 | 84.60 | 92.20 |
| Inupiat | 60.27 | 55.20 | 65.40 | 85.93 | 83.00 | 89.00 |
| Yup’ik | 49.29 | 44.20 | 54.40 | 82.50 | 79.40 | 85.60 |
| Aleut | 75.81 | 68.00 | 83.60 | 89.03 | 85.40 | 92.80 |
| Other Alaska Native | 67.10 | 58.80 | 75.40 | 86.02 | 81.00 | 91.00 |
| Other AIAN specified | 68.74 | 65.20 | 72.20 | 86.65 | 84.40 | 88.80 |
| AIAN, not specified | 70.68 | 69.20 | 72.20 | 80.81 | 79.80 | 81.80 |
Source: Data derived from the 2015–2019 American Community Survey, AI: American Indian.
Disparities in Disability and Socioeconomic Characteristics Across 75 Largest American Indian and Alaska Native Tribal Areas
Selected socioeconomic and disability characteristics for the 75 largest AIAN tribal areas in terms of the AIAN population size during 2015–2019 are shown in Table 5. Socioeconomic characteristics varied greatly among the 75 largest tribal areas. Poverty rates were highest for Rosebud Indian Reservation and Off-Reservation Trust Land, SD (63.3%), Spirit Lake Reservation, ND (50.7%), and Standing Rock Reservation, SD—ND (50.6%), and lowest for Nome ANVSA (Alaska Native Village Statistical Area), AK (10.5%), Knik ANVSA, AK (11.2%), and Saint Regis Mohawk Reservation, NY (12.1%). Among all tribal areas with at least 40 AIAN residents, Eklutna ANSVA, AK (94.6%), and Gakona ANSVA, AK (88.9%), had the highest poverty rates (data not shown).
| Tribal/Geographic Area Name | Total AIAN Population | Median Household Income | White collar Occupation % | Home Ownership Rate % | Poverty Rate % | Unemployment Rate % | Without High School Diploma % | Bachelor’s Degree and Above % | Total Disability Rate % |
|---|---|---|---|---|---|---|---|---|---|
| Navajo Nation Reservation and Off-Reservation Trust Land, AZ–NM–UT | 166,464 | $27,053 | 42.77 | 78.42 | 39.20 | 8.87 | 25.55 | 6.93 | 15.40 |
| Cherokee OTSA, OK | 87,389 | $44,554 | 48.20 | 67.65 | 21.87 | 5.26 | 14.54 | 16.07 | 17.60 |
| Lumbee (state) SDTSA, NC | 65,793 | $34,386 | 41.55 | 69.44 | 27.89 | 4.87 | 25.78 | 12.11 | 17.50 |
| Creek OTSA, OK | 59,647 | $46,961 | 54.16 | 59.72 | 19.46 | 4.55 | 13.10 | 18.97 | 14.80 |
| Choctaw OTSA, OK | 27,249 | $39,174 | 46.06 | 62.19 | 22.87 | 5.66 | 15.27 | 14.44 | 19.30 |
| Chickasaw OTSA, OK | 23,079 | $51,042 | 49.38 | 69.04 | 16.12 | 4.29 | 13.61 | 15.26 | 16.40 |
| Pine Ridge Reservation, SD–NE | 17,179 | $31,097 | 46.56 | 47.19 | 49.12 | 9.67 | 29.15 | 8.84 | 14.20 |
| Fort Apache Reservation, AZ | 14,795 | $29,367 | 45.26 | 61.27 | 44.09 | 13.25 | 30.49 | 4.96 | 16.80 |
| Rosebud Indian Reservation and Off-Reservation Trust Land, SD | 10,107 | $17,106 | 57.18 | 42.89 | 63.26 | 4.16 | 24.69 | 10.18 | 6.30 |
| San Carlos Reservation, AZ | 9696 | $33,929 | 45.80 | 64.60 | 47.00 | 15.94 | 28.28 | 4.32 | 12.60 |
| Kiowa-Comanche-Apache-Fort Sill Apache OTSA, OK | 9694 | $38,427 | 46.13 | 52.30 | 21.94 | 9.99 | 14.64 | 12.32 | 17.70 |
| Gila River Indian Reservation, AZ | 9506 | $22,241 | 41.17 | 44.49 | 44.95 | 6.67 | 33.29 | 4.37 | 14.10 |
| Citizen Potawatomi Nation-Absentee Shawnee OTSA, OK | 9232 | $49,894 | 47.96 | 78.39 | 14.63 | 3.37 | 13.49 | 13.50 | 14.20 |
| Tohono O’odham Nation Reservation and Off-Reservation Trust Land, AZ | 9052 | $27,875 | 42.28 | 62.51 | 47.59 | 16.03 | 25.31 | 4.27 | 20.60 |
| Hopi Reservation and Off-Reservation Trust Land, AZ | 8891 | $37,299 | 46.40 | 73.70 | 37.42 | 5.36 | 12.15 | 6.43 | 9.50 |
| Blackfeet Indian Reservation and Off-Reservation Trust Land, MT | 8865 | $30,469 | 59.99 | 55.64 | 35.14 | 6.73 | 12.47 | 20.27 | 7.50 |
| Turtle Mountain Reservation and Off-Reservation Trust Land, MT–ND–SD | 8776 | $36,059 | 48.79 | 69.51 | 32.23 | 6.43 | 13.64 | 17.26 | 17.80 |
| Zuni Reservation and Off-Reservation Trust Land, NM–AZ | 8713 | $37,668 | 40.89 | 84.00 | 36.71 | 13.50 | 22.16 | 4.90 | 16.80 |
| United Houma Nation (state) SDTSA, LA | 8036 | $42,361 | 44.19 | 65.45 | 25.13 | 4.23 | 36.01 | 7.77 | 15.20 |
| Flathead Reservation, MT | 7988 | $35,532 | 49.37 | 56.94 | 32.77 | 9.75 | 14.01 | 19.15 | 13.20 |
| Wind River Reservation and Off-Reservation Trust Land, WY | 7794 | $42,367 | 42.62 | 57.96 | 25.94 | 10.75 | 11.25 | 8.58 | 13.00 |
| Mississippi Choctaw Reservation, MS | 7398 | $33,559 | 39.18 | 71.94 | 39.36 | 8.47 | 25.96 | 7.75 | 16.80 |
| Cheyenne-Arapaho OTSA, OK | 7190 | $53,348 | 59.52 | 52.85 | 17.49 | 7.51 | 15.66 | 12.60 | 11.90 |
| Yakama Nation Reservation and Off-Reservation Trust Land, WA | 6902 | $43,699 | 47.21 | 54.32 | 36.23 | 12.99 | 19.18 | 8.59 | 12.40 |
| Fort Peck Indian Reservation and Off-Reservation Trust Land, MT | 6818 | $27,831 | 42.21 | 48.92 | 40.58 | 12.49 | 19.05 | 11.79 | 12.00 |
| Cheyenne River Reservation and Off-Reservation Trust Land, SD | 6691 | $37,122 | 58.39 | 51.19 | 41.86 | 22.14 | 18.76 | 12.66 | 10.40 |
| Eastern Cherokee Reservation, NC | 6669 | $43,094 | 40.27 | 72.96 | 16.03 | 2.45 | 18.50 | 11.52 | 18.70 |
| Standing Rock Reservation, SD–ND | 6518 | $26,750 | 53.22 | 35.80 | 50.60 | 18.01 | 20.73 | 13.40 | 11.40 |
| Sac and Fox OTSA, OK | 6291 | $40,077 | 51.19 | 59.28 | 21.50 | 4.53 | 17.17 | 14.13 | 14.20 |
| Osage Reservation, OK | 6027 | $49,441 | 51.77 | 73.33 | 15.10 | 5.68 | 11.00 | 15.40 | 16.30 |
| Crow Reservation and Off-Reservation Trust Land, MT | 5978 | $46,141 | 55.08 | 71.72 | 32.47 | 12.18 | 10.55 | 14.97 | 8.70 |
| Salt River Reservation, AZ | 5591 | $40,524 | 41.02 | 74.52 | 37.53 | 19.21 | 31.88 | 4.86 | 16.70 |
| Red Lake Reservation, MN | 5560 | $39,645 | 52.17 | 53.76 | 30.75 | 18.92 | 24.77 | 6.85 | 10.20 |
| Knik ANVSA, AK | 4917 | $57,000 | 47.26 | 65.91 | 11.21 | 7.01 | 13.57 | 7.05 | 12.40 |
| Fort Berthold Reservation, ND | 4794 | $52,898 | 56.01 | 54.68 | 23.45 | 7.05 | 10.35 | 18.67 | 13.40 |
| Lake Traverse Reservation and Off-Reservation Trust Land, SD–ND | 4634 | $31,542 | 46.77 | 35.49 | 40.00 | 9.58 | 17.20 | 6.97 | 9.00 |
| Seminole OTSA, OK | 4619 | $37,337 | 47.70 | 55.03 | 28.41 | 6.36 | 17.13 | 12.43 | 20.40 |
| Leech Lake Reservation and Off-Reservation Trust Land, MN | 4555 | $34,659 | 45.04 | 54.27 | 35.08 | 12.92 | 12.71 | 9.18 | 14.10 |
| Kiowa-Comanche-Apache-Ft Sill Apache/Caddo-Wichita-Delaware joint-use OTSA, OK | 4423 | $31,736 | 47.68 | 55.51 | 35.35 | 10.03 | 8.20 | 17.15 | 15.80 |
| Northern Cheyenne Indian Reservation and Off-Reservation Trust Land, MT–SD | 4392 | $47,500 | 50.58 | 56.04 | 27.10 | 9.70 | 10.86 | 12.46 | 11.00 |
| Oneida (WI) Reservation and Off-Reservation Trust Land, WI | 4384 | $43,008 | 48.59 | 51.02 | 24.84 | 7.12 | 6.39 | 18.83 | 15.70 |
| White Earth Reservation and Off-Reservation Trust Land, MN | 4241 | $31,216 | 40.94 | 56.70 | 39.69 | 9.65 | 17.25 | 7.49 | 16.90 |
| Bethel ANVSA, AK | 4154 | $61,050 | 62.28 | 36.64 | 19.63 | 10.07 | 13.57 | 7.02 | 7.10 |
| Warm Springs Reservation and Off-Reservation Trust Land, OR | 3819 | $47,667 | 44.20 | 64.99 | 34.19 | 15.20 | 17.88 | 8.94 | 15.70 |
| Colville Reservation and Off-Reservation Trust Land, WA | 3791 | $38,480 | 54.30 | 63.33 | 24.69 | 9.19 | 15.56 | 11.14 | 19.00 |
| Laguna Pueblo and Off-Reservation Trust Land, NM | 3724 | $34,250 | 47.36 | 83.23 | 32.13 | 12.90 | 9.01 | 9.37 | 21.80 |
| Spirit Lake Reservation, ND | 3686 | $28,616 | 44.12 | 44.62 | 50.67 | 5.86 | 23.18 | 6.15 | 18.40 |
| Mescalero Reservation, NM | 3588 | $33,603 | 44.97 | 57.75 | 35.04 | 11.79 | 18.25 | 10.70 | 13.60 |
| Pascua Pueblo Yaqui Reservation and Off-Reservation Trust Land, AZ | 3498 | $36,250 | 39.29 | 33.49 | 36.19 | 8.19 | 34.28 | 3.32 | 18.00 |
| Fort Hall Reservation and Off-Reservation Trust Land, ID | 3481 | $35,795 | 37.83 | 77.46 | 25.26 | 14.48 | 13.34 | 8.50 | 21.40 |
| Rocky Boy’s Reservation and Off-Reservation Trust Land, MT | 3477 | $30,436 | 45.64 | 41.75 | 33.74 | 4.83 | 17.21 | 10.14 | 6.60 |
| Isleta Pueblo, NM | 3368 | $38,173 | 53.51 | 94.37 | 26.81 | 7.70 | 12.92 | 11.33 | 18.80 |
| Colorado River Indian Reservation, AZ–CA | 3062 | $32,578 | 37.91 | 49.03 | 40.11 | 12.50 | 24.29 | 6.61 | 16.80 |
| Fort Belknap Reservation and Off-Reservation Trust Land, MT | 3002 | $31,711 | 75.78 | 48.44 | 43.67 | 20.95 | 12.64 | 12.06 | 22.90 |
| Jicarilla Apache Nation Reservation and Off-Reservation Trust Land, NM | 2967 | $45,486 | 59.54 | 74.66 | 24.14 | 19.15 | 13.84 | 9.10 | 17.90 |
| Menominee Reservation, WI | 2962 | $31,071 | 35.97 | 57.76 | 41.26 | 7.88 | 8.50 | 10.22 | 15.30 |
| Yankton Reservation, SD | 2904 | $31,375 | 41.61 | 38.14 | 42.56 | 13.50 | 24.57 | 7.54 | 15.00 |
| Lummi Reservation, WA | 2895 | $41,625 | 61.67 | 52.49 | 20.87 | 4.77 | 16.90 | 12.78 | 20.20 |
| Nez Perce Reservation, ID | 2760 | $43,854 | 51.14 | 58.40 | 27.35 | 10.36 | 7.76 | 11.57 | 18.30 |
| Saint Regis Mohawk Reservation, NY | 2709 | $40,383 | 100.00 | 85.14 | 12.11 | 23.83 | 0.00 | 12.54 | 23.60 |
| Uintah and Ouray Reservation and Off-Reservation Trust Land, UT | 2709 | $39,844 | 51.78 | 70.50 | 39.16 | 10.13 | 30.23 | 4.13 | 11.00 |
| Barrow ANVSA, AK | 2678 | $55,956 | 62.05 | 59.13 | 17.08 | 16.97 | 20.17 | 2.16 | 14.80 |
| Hoopa Valley Reservation, CA | 2652 | $38,125 | 44.18 | 69.42 | 37.59 | 4.71 | 16.05 | 12.06 | 18.40 |
| Acoma Pueblo and Off-Reservation Trust Land, NM | 2635 | $46,765 | 44.84 | 92.35 | 19.24 | 10.14 | 10.28 | 11.24 | 18.20 |
| San Felipe Pueblo, NM | 2624 | $41,094 | 39.51 | 73.40 | 26.27 | 7.88 | 29.65 | 6.81 | 11.50 |
| Santo Domingo Pueblo, NM | 2607 | $34,583 | 46.12 | 71.75 | 28.10 | 2.78 | 18.66 | 5.18 | 9.90 |
| Haliwa-Saponi (state) SDTSA, NC | 2504 | $33,566 | 34.39 | 78.39 | 25.96 | 3.83 | 33.21 | 8.15 | 24.00 |
| Kenaitze ANVSA, AK | 2424 | $52,539 | 34.91 | 50.76 | 19.30 | 9.60 | 15.78 | 9.70 | 13.70 |
| Nome ANVSA, AK | 2296 | $61,680 | 60.58 | 44.77 | 10.45 | 11.00 | 14.64 | 7.01 | 9.50 |
| Omaha Reservation, NE–IA | 2294 | $35,714 | 52.98 | 42.71 | 38.27 | 19.00 | 16.62 | 5.68 | 14.70 |
| Kotzebue ANVSA, AK | 2277 | $58,125 | 62.40 | 47.67 | 25.30 | 8.27 | 16.22 | 4.48 | 9.10 |
| Kickapoo OTSA, OK | 2201 | $40,673 | 46.52 | 59.22 | 27.64 | 7.78 | 18.51 | 12.13 | 14.00 |
| Kaw/Ponca joint-use OTSA, OK | 2195 | $47,976 | 54.98 | 51.47 | 23.59 | 8.57 | 16.89 | 13.61 | 16.30 |
| Jemez Pueblo, NM | 2031 | $41,597 | 34.46 | 84.28 | 24.48 | 2.20 | 16.35 | 6.06 | 10.70 |
| Isabella Reservation, MI | 1970 | $64,152 | 45.44 | 72.08 | 14.78 | 6.26 | 25.84 | 11.06 | 21.90 |
Source: Data derived from the 2015–2019 American Community Survey.
Disparities in Physical and Mental Health, Health-Related Behaviors, and Cancer Screening: The 2018–2020 BRFSS
Approximately 19.1% of AIAN adults reported experiencing 14 or more days of poor mental health during the past month compared with 13.3% of the total US adult population. AIAN adults were 65% more likely to experience 14 or more days of poor physical health during the past month than their US counterparts (19.3% vs. 11.6%). AIAN adults reported higher prevalence of obesity, diabetes, physical inactivity, current smoking, and heavy drinking than the general US population [Figure 11].
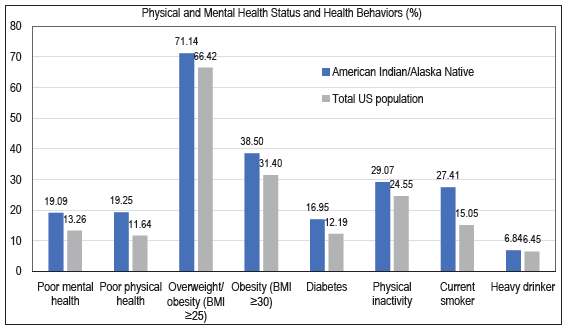
- General Health Status, Mental Health Status, and Selected Health-Risk Behaviors among American Indians and Alaska Natives and the US Population aged ≥ 18 Years, United States, 2018–2020
-
Source: Data derived from the 2018–2020 Behavioral Risk Factor Surveillance System.
AIANs’ adults had a significantly higher prevalence of cancer, heart disease, and COPD than the general US population. AIAN adults were significantly less likely to report breast, cervical, prostate, and colorectal cancer screening than their US counterparts. Although more than 85% of AIAN adults reported having access to health insurance, they were 33% more likely than the general US population to report not being able to see a doctor in the past year due to cost [Figure 12].
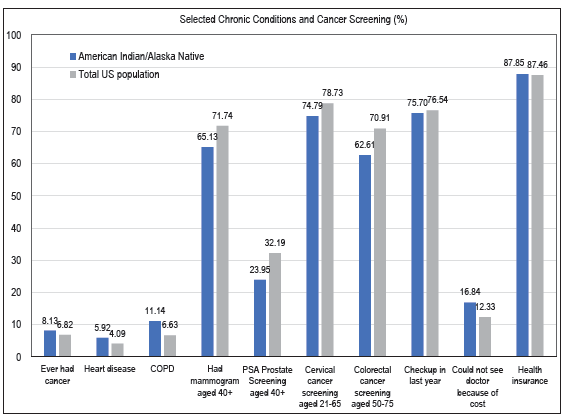
- Prevalence of Selected Chronic Conditions and Cancer Screening among American Indians and Alaska Natives and the US Population aged ≥ 18 Years, United States, 2018–2020
-
Source: Data derived from the 2018–2020 Behavioral Risk Factor Surveillance System.
- Notes: Colorectal cancer screening indicates whether respondent met the US Preventive Services Task Force recommendation for screening. Mammogram and PSA screenings are within the past two years, cervical screening within the past three years, and colorectal screening time frame is conditional on type of screening: colonoscopy, virtual colonoscopy or sigmoidoscopy five years, bloodstool test one year, and stool DNA test three years. Delay of doctor visit is for any instance in the previous year where needed care was missed.
DISCUSSION
In this study, we have analyzed major health and social inequality trends and patterns among AIANs. Documenting long-term trends and patterns in mortality from leading causes of death among AIANs using a comparative ethnic framework and analyzing tribe/tribal area-specific data on disability, health insurance, and socioeconomic conditions are two novel features of this study.
We found striking disparities in several health indicators, with AIANs experiencing shorter life expectancy compared to other racial/ethnic groups except Black Americans, high rates of premature mortality, infant and child mortality, diabetes, liver cirrhosis, alcohol-related mortality, suicides, and unintentional injuries than the general population and other major racial/ethnic groups.
Our study is consistent with an earlier study that analyzed mortality data for 2019.[4] However, compared to the pre-pandemic year of 2019, mortality rates for AIANs increased significantly in the peak pandemic year of 2021 for the following major causes of death: CVD, including heart disease and stroke, cervical cancer, unintentional injuries, diabetes, COPD, Alzheimer’s disease, suicide, homicide, cirrhosis, alcohol-related causes, drug overdose, and firearm injuries. Similar increases were also observed for non-Hispanic Whites and the total US population.
Inequities in life expectancy, cause-specific mortality, including COVID-19 mortality, among AIANs might be explained by racial/ethnic differences in socioeconomic characteristics, occupational exposures, social isolation, preventive COVID-related behaviors, COVID-19 vaccinations, severe COVID symptoms at diagnosis, comorbidities, and access to care and treatment, among other factors.[27]
Inequities in mental and physical health and access to healthcare are very marked. Compared with any other major racial/ethnic groups, AIANs are significantly more likely to rate their physical and mental health as poor.[4] Almost one in five AIAN adults assess their physical and mental health as poor at nearly twice the rate of non-Hispanic Whites or the general population.[4] More than 10% of AIAN adults experience serious psychological distress, which is three times higher than the prevalence for non-Hispanic Whites and six times higher than the prevalence for APIs.[4] AIANs have the highest disability and uninsured rates of all major racial/ethnic groups in the US. Nearly 18% of AIANs report a disability and 20% are without health insurance. In certain tribal communities such as Seminole, Crow, and Comanche, 30% of the population or higher lacks health insurance.
AIANs are disadvantaged in their behavioral risk profile that contributes to their poorer health status relative to other groups. Of all the major racial/ethnic groups, AIANs have among the highest rates of adult obesity, smoking, heavy alcohol consumption, and physical inactivity and the lowest rates of breast, cervical, and colorectal cancer screening.[4] Socioeconomic and material living conditions of AIANs are less favorable compared to other groups. AIANs have the highest poverty rates of any major racial/ethnic group, with 27% of the AIAN population living in poverty. Poverty rates among many of the tribal groups and areas are astonishingly high, with poverty rates in these communities exceeding 60%.
Digital platforms such as telehealth, social media, and digital health literacy have an important role to play in increasing access to physical and mental healthcare and services, improving quality of life, and reducing inequalities in physical and mental health outcomes.[28–30] However, in the US there is a clear digital divide driven by socioeconomic status (SES) and race and ethnicity.[31,32] High SES and non-Hispanic White populations have improved access to digital health resources such as reliable and affordable high-speed internet when compared to low SES and racial and ethnic minority populations.[31,32] According to a recent US study, individuals and communities with little or no broadband access and computer use experience substantial health disparities in terms of seven years shorter life expectancy, higher mortality from various chronic conditions such as cardiovascular, cancer, and diabetes, poor health, disability, mental distress, preventable hospitalization, smoking, obesity, physical inactivity, reduced access to healthcare, lower educational attainment, and higher unemployment and poverty rates.[26]
Populations that accrue the most health-enhancing benefits of social media are often White populations, younger age, and those with higher education.[29,33] By contrast, racial and ethnic minority groups, those with low education attainment, and older populations are more likely to have decreased access to digital platform tools such as physical and mental telehealth services that could improve overall health and quality of life.[29,30,32,33] Therefore, improving digital health literacy could be one way to advance mental and physical health equity for the AIAN populations. To be specific, targeted resources and policies that increase AIANs’ access to stable, high-speed internet that support digital platforms, including telehealth services and social media, will be a necessary tool to close the digital divide and increased AIANs’ access to health information and services.[28,29,32,33]
Limitations
Limitations of the study include possible underreporting of mortality statistics for AIANs on the death certificate and inconsistencies in the reporting of AIAN race or ethnicity in mortality (numerator) and population (denominator) data.[4,12,13,27] Consequently, mortality rates for AIANs based on vital records may be underestimated and life expectancy overestimated, implying a smaller disparity for AIANs than actually is the case. However, cause-specific mortality and mortality rates for AIANs aged 25–64 shown here appear to be consistent with those based on longitudinal databases such as the National Longitudinal Mortality Study and the National Health Interview Survey-National Death Index Record Linkage Study in which race/ethnicity is self-reported.[4,12,27] Federal health surveys and administrative databases, including NVSS, do not include tribe-specific data. Although limited health measures such as disability and health insurance are available in the ACS, tribal data on mortality, morbidity, and health conditions are completely lacking.
CONCLUSION AND GLOBAL HEALTH IMPLICATIONS
AIANs remain a disadvantaged racial/ethnic group in several key health indicators and socioeconomic and living conditions, with poverty rates in many tribal communities exceeding 40%. The COVID-19 pandemic worsened their health and well-being relative to the other groups in the US. Declines in life expectancy, high rates of poverty, lack of health insurance, reduced access to healthcare services, and unfavorable socioeconomic conditions of AIAN populations and tribal communities are major areas of concern that require increased policy attention.
Although reduced smoking, greater physical activity, lower obesity, healthy diet, higher seatbelt use, avoiding substance use, and improved access to and use of healthcare services can lead to improvements in the health of AIANs, these factors are themselves primarily influenced by the broader, more upstream social determinants such as education, income, social and welfare services, affordable housing, job creation, labor market opportunities, and transportation.[3,4] Addressing and finding solutions to reducing these marked inequities in social determinants should be an important policy focus for tackling health inequalities among AIANs and those between AIANs and the other racial and ethnic groups in the US.[3,4]
Key Messages
-
In 2021, life expectancy at birth was 70.6 years for AIANs, significantly lower than that for APIs (84.1), Hispanics (78.8), and non-Hispanic Whites (76.3).
-
Between the pre-pandemic year of 2019 and the peak pandemic year of 2021, AIANs experienced the greatest decline in life expectancy of 6.3 years, followed by Blacks (5.8 years).
-
COVID-19 was the leading cause of death among AIANs in 2021. Risks of mortality from alcohol-related problems, drug overdose, unintentional injuries, and homicide were markedly higher among AIANs than non-Hispanic Whites or the general population.
-
AIANs have the highest disability and uninsured rates of all major racial/ethnic groups in the US. Nearly 18% of AIANs report a disability and 20% are without health insurance.
-
Poverty rates among many tribal groups are astonishingly high. Poverty rates exceed 60% in many Native American tribal areas and reservations, including Eklutna, AK (94.6%); Gakona, AK (88.9%); Klamath Reservation, OR (70.4%); and Rosebud Indian Reservation, SD (63.3%).
-
Declines in life expectancy, high rates of poverty, lack of health insurance, reduced access to healthcare services, and unfavorable socioeconomic and living conditions of AIAN populations and tribal communities are major areas of concern that require increased policy attention.
ACKNOWLEDGMENTS
None.
COMPLIANCE WITH ETHICAL STANDARDS
Conflicts of Interest
Dr. Gopal Singh is on the editorial board of Int J MCH AIDS.
Financial Disclosure
Nothing to declare.
Funding/Support
There was no funding for this study.
Ethics Approval
Institutional Review Board approval is not required for this study, as it is based on the secondary analysis of several public-use federal databases.
Declaration of Patient Consent
Patient’s consent not required as there are no patients in this study.
Use of Artificial Intelligence (AI)-Assisted Technology for Manuscript Preparation
The authors confirm that there was no use of AI-assisted technology for assisting in the writing or editing of the manuscript and no images were manipulated using the AI.
Disclaimer
The views expressed are the authors’ and not necessarily those of their institutions’.
References
- Health Resources and Services Administration. Office of Health Equity. Health Equity Report 2019–2020: Special Feature on Housing and Health Inequalities. 2020. [Accessed February 9, 2024]. Available from: https://www.hrsa.gov/sites/default/files/hrsa/health-equity/HRSA-health-equity-report-printer.pdf
- Health equity report 2017. Health resources and services Administration, Office of Health Equity. Rockville, Maryland: US Department of Health and Human Services; 2018. [Accessed February 9, 2024]. Available from: https://www.hrsa.gov/sites/default/files/hrsa/health-equity/2017-HRSA-health-equity-report-PRINTER.pdf
- Social determinants of health in the United States: Addressing major health inequality trends for the nation, 1935–2016. Int J MCH and AIDS. 2017;6(2):139-64.
- [CrossRef] [PubMed] [PubMed Central] [Google Scholar]
- Trends in physical and mental health, mortality, life expectancy, and social inequalities Among American Indians and Alaska Natives, 1990–2019. Int J Transl Med Res Public Health. 2021;5(2):227-53.
- [Google Scholar]
- Social determinants of American Indian nutritional health. Curr Dev Nutr. 2019;3(Suppl 2):12-8.
- [CrossRef] [PubMed] [PubMed Central] [Google Scholar]
- The National Tribal Behavioral Health Agenda Overview. 2016. [Accessed February 9, 2024]. Available from: https://nihb.org/docs/12052016/FINAL%20TBHA%2012-4-16.pdf
- Historical trauma and American Indian/Alaska Native youth mental health development and delinquency. New Dir Child Adolesc Dev. 2020;2020(169):41-58.
- [CrossRef] [PubMed] [Google Scholar]
- Historical trauma and substance use among American Indian people with current substance use problems. Psychol Addict Behav. 2021;35(3):295-309.
- [CrossRef] [PubMed] [PubMed Central] [Google Scholar]
- Facts for Features: American Indian and Alaska Native Heritage Month: November 2022. Washington, DC: US Census Bureau; [Accessed February 9, 2024]. Available from: https://www.census.gov/newsroom/facts-for-features/2022/aian-month.html
- Health, United States, 2015: With Special Feature on Racial and Ethnic Health Disparities. Hyattsville, MD; 2016.
- The 2022 American Community Survey. [Accessed February 9, 2024]. Available from: https://www.census.gov/programs-surveys/acs/. Published 2022
- Immigrant health inequalities in the United States: Use of eight major national data systems. Sci World J. 2013;2013:512313.
- [CrossRef] [PubMed] [PubMed Central] [Google Scholar]
- Deaths: Final data for 2020. Natl Vital Stat Rep. 2023;72(10):1-92. [Accessed February 9, 2024]. Available from: https://www.cdc.gov/nchs//data/nvsr/nvsr72/nvsr72-10.pdf
- [PubMed] [Google Scholar]
- National Vital Statistics System, Mortality Multiple Cause-of-Death Public Use Data File Documentation, 2020 and 2021. Hyattsville, MD: US Department of Health and Human Services; [Accessed February 9, 2024]. Available from: http://www.cdc.gov/nchs/nvss/mortality_public_use_data.htm. Published 2022
- Mortality in the United States, 2020. NCHS Data Brief; 2021. No. 47. [Accessed February 9, 2024]. Available from: https://www.cdc.gov/nchs/data/databriefs/db427.pdf
- Area deprivation and widening inequalities in US mortality, 1969–1998. Am J Public Health. 2003;93(7):1137-43.
- [CrossRef] [PubMed] [PubMed Central] [Google Scholar]
- Area deprivation and inequalities in health and health care outcomes. Ann Intern Med. 2019;171(2):131-2.
- [CrossRef] [PubMed] [Google Scholar]
- Increasing area deprivation and socioeconomic inequalities in heart disease, stroke, and cardiovascular disease mortality among working age populations, United States, 1969–2011. Int J MCH and AIDS. 2015;3(2):119-33.
- [PubMed] [PubMed Central] [Google Scholar]
- User Guide to the 2019 Period Linked Birth/Infant Death Public Use File. Hyattsville, MD: Centers for Disease Control and Prevention, US Department of Health and Human Services; 2021. [Accessed February 9, 2024]. Available from: https://ftp.cdc.gov/pub/Health_Statistics/NCHS/Dataset_Documentation/DVS/period-cohort-linked/19PE18CO_linkedUG.pdf
- The American Community Survey (ACS) Public Use Microdata Sample (PUMS), 2015–2019. [Accessed February 9, 2024]. Available from: https://www.census.gov/programs-surveys/acs/microdata.html
- About BRFSS. 2022. [Accessed February 9, 2024]. Available from: https://www.cdc.gov/brfss/about/index.htm
- Behavioral Risk Factor Surveillance System Overview: BRFSS 2020. Atlanta, GA; 2021. [Accessed February 9, 2024]. Available from: https://www.cdc.gov/brfss/annual_data/2020/pdf/overview-2020-508.pdf
- Behavioral Risk Factor Surveillance System 2020: LLCP Codebook Report. 2021. [Accessed February 9, 2024]. Available from: https://www.cdc.gov/brfss/annual_data/2020/pdf/codebook20_llcp-v2-508.pdf. Accessed February 9, 2024
- Computer and internet use in the United States: 2016. American community survey reports. ACS-39. Washington, DC: US Census Bureau; 2017.
- Consider broadband access as a social determinant of health. American Medical Informatics Association (AMIA); 2017. [Accessed September 6, 2022]. Available from: https://healthitanalytics.com/news/amia-consider-broadband-access-a-social-determinate-of-health
- Digital divide: Marked disparities in computer and broadband internet use and associated health inequalities in the United States. Int J Transl Med Res Public Health. 2020;4(1):64-79.
- [Google Scholar]
- Widening disparities in COVID-19 mortality and life expectancy among 15 major racial and ethnic groups in the United States, 2020–2021. J Racial Ethn Health Disparities 2024 Mar 7 10.1007/s40615-024-01966-6
- [CrossRef] [PubMed] [Google Scholar]
- Telehealth and the digital divide as a social determinant of health during the COVID-19 pandemic. Netw Model Anal Health Inform Bioinform. 2021;10(1):26.
- [CrossRef] [PubMed] [PubMed Central] [Google Scholar]
- Social media role and its impact on public health: A narrative review. Cureus. 2023;15(1):e33737.
- [CrossRef] [PubMed] [PubMed Central] [Google Scholar]
- Trends in health communication: social media needs and quality of life among older adults in Malaysia. Healthcare (Basel). 2023;11(10):1455.
- [CrossRef] [PubMed] [PubMed Central] [Google Scholar]
- Digital health equity. In: Linwood SL, ed. Digital health. Brisbane (AU): Exon Publications; 2022.
- [Google Scholar]
- US’s digital divide ‘is going to kill people’ as COVID-19 exposes inequalities. The Guardian 2020 Apr 13
- [Google Scholar]
- The evolving role of social media in enhancing quality of life: A global perspective across 10 countries. Arch Public Health. 2024;82(1):28.
- [CrossRef] [PubMed] [PubMed Central] [Google Scholar]


