Translate this page into:
Has the Rate of Reduction in Infant Mortality Increased in India Since the Launch of National Rural Health Mission? Analysis of Time Trends 2000-2009 with Projection to 2015
-
Received: ,
Accepted: ,
Abstract
Objectives:
National Rural Health Mission (NRHM) - India was launched in 2005 to tackle urban-rural health inequalities, especially in maternal and child health. We examined national and state level trends in Infant Mortality Rates (iMR) from 2000 through 2009 to: 1) assess whether the NRHM had increased the average annual reduction rate (AARR) of IMR 2) evaluate state-wise progress towards Millennium Development Goals (MDG4) and estimate required AARRs for ‘off track’ states.
Methods:
Log-linear regression models were applied to national and state IMR data collated from the Sample Registration System (SRS)-India to estimate average annual reduction rates and compare AAARs before and after introduction of NRHM. The log-linear trend of infant mortality rates was also projected forward to 2015.
Results:
The infant mortality rate in rural India declined from 74 to 55/1000 live births between 2000 and 2009, with AARR of 3.0% (95% CI=2.6%-3.4%) and the urban-rural gap in infant mortality narrowed (p =0.036). However there was no evidence (p=0.49) that AARR in rural India increased post NRHM (3.4%, 95% CI 2.0-4.7%) compared to pre NRHM (2.8%, 95% CI 2.1%-3.5%). States varied widely in rates of infant mortality reduction. Projections of infant mortality rates suggested that only eight states might be on track to help India achieve MDG4 by 2015.
Conclusions and Public Health Implications:
Despite a narrowing urban-rural gap and high AARRs in some states, there was no evidence that the rate of reduction in infant mortality has increased in rural India post NRHM introduction. India appears unlikely to achieve child survival-related NRHM and millennium development goals. Government should revisit the child survival related NRHM strategies and ensure equitable access to health services. More robust monitoring and evaluation mechanisms must be inbuilt for following years.
Keywords
India
National Rural Health Mission
Infant Mortality Rate
Millennium Development Goals
Health Systems

Introduction
India's under-five mortality rate (U5MR) has declined by 32%; from 116 in 1990 to 66 per 1000 live births in 2009, placing it 48th globally[1]. However, the highest number (1.69 million) of under-five deaths globally continue to occur in India[2]. Nearly two thirds of these deaths are preventable with available interventions that can be implemented in low-income countries[3,4]. India's progress has huge strategic importance in the global quest for Millennium Development Goals (MDG4). This largely depends on tackling infant mortality (forming >70% of all under five deaths[5-7]) in rural areas where >70% population lives and where the infant mortality rate (IMR) historically has stayed twice as high as urban areas (Figure 1).

- Spatial IMR Trends and Various Health Programs in India: 1980-2009. CSSM=Child Survival and Safe Motherhood; RCH-l=Reproductive and Child Health phase 1; NRHM=National Rural Health Mission.
National Rural Health Mission (2005-2012)
To address the striking urban-rural health inequalities[8], National Rural Health Mission (NRHM) was launched by the Government of India in April 2005.
Eighteen states with weak health infrastructure and indicators were categorized as High Focus states[9] (Fig 2). The key aim of NRHM is to reduce India's IMR from 58 in 2005 to 30/1000 live births by 2012, in order to reach MDG4[10].

- Categorization of States as per National Rural Health Mission (NRHM) and state-wise burden of infant deaths.
Since the launch of NRHM, government reports[9,11] and independent reviews[12-14] show a visible increase in the supply (increased 24 × 7 functioning health facilities-3-to 6-fold, drugs, consumables and flexible finances, additional 9,000 doctors, 60,000 nurses/ANMs and 690,000 ASHAs) and demand side (increased attendance to in-door and out-patients' departments and institutional deliveries) of health services. Going by the components of the health program (Figure 3), these NRHM reports and reviews provide useful insight into the input & pocess, output and outcome measures. However, despite the approaching NRHM deadline (20'2), and considerable resource mobilization for improving childs, little is known about the extent to which these interventions have had an impact on infant mortality rates. The objectives of our study were to 1) describe time trends in infant mortality at national and state level between 2000 and 2009,2) establish whether there was an increase in the annual average reduction rate (AARR) of IMR in rural areas, after the launch of NRHM and 3) to assess whether India and its states are likely to achieve the NRHM goal (national IMR of 30/1000 live births by 2012) or MDG4 (2/3rd reduction in baseline U5MR of 1990, by 2015). Since there is insufficient state-level U5MR information, we used IMR as an indicator.

- Basic Health Systems Framework
Methods
NRHM was implemented in all states of India, so we were limited to performing a before-and after-comparison due to the lack of control areas. Infant mortality rate (IMR) was the dependent variable defined as number of deaths in children under one year of age per 1000 live births in that year.
Data
National and state level IMR data was derived from the Sample Registration System (SRS)[15]. Under SRS, panel household surveys are conducted for 1.5 million households with 7.1 million people living in 7,597 (as of year 2004) randomly selected villages (60%) and urban blocks (40%) spread across all states. The data collection involves continuous enumeration of births and deaths, which is cross verified and matched biannually (for detailed methods refer to: http://censusindia.gov.in/Vital_ Statistics/SRS/Sample_Registration_System.aspx). The figures obtained from SRS are widely used by national and international development agencies and its U5MR data has been found particularly reliable[16]. Besides, SRS became an obvious choice since it is the only source providing yearly IMR estimates at the state level; including separate urban-rural figures. All of the data was compiled from online sources in the public domain. Please note, throughout this article we refer to aggregate urban and rural IMR figures as total IMR.
Analysis
Our analysis focused on average annual reduction rates (AARRs) which measure the average percent reduction in IMR per year. A positive value of AARR suggests average annual decrease in IMR and conversely negative AARR suggests an average annual increase. At both the national and state level, the analyses involved:
Descriptive analysis of AARRs for the period 2000-2009 using urban, rural and total IMRs;
Estimates of the absolute change in rate of IMR reduction in rural India using the separate AARRs for pre-and post-NRHM;
Forecasting total IMR up until 2015; estimating the required AARR in order to reach MDG4.
To compare IMR trends before and after NRHM, we used piecewise linear regression on log IMRs. This model assumes a single underlying linear trend during the pre-NRHM era up until the cut-off point followed by a different trend during the post-NRHM era. For pragmatic reasons, we pre-specified the cut-off point as exactly 6 months after the initiation date of NRHM for each state. For nation-wide analyses, we chose the launch date for NRHM as a whole, April 2005. 95% CIs for absolute differences and tests for no difference between AARRs before and after NRHM were calculated using the delta method[17]. Overall AARRs for the whole period from 2000 to 2009 were computed using simple linear regression on the log (rural) IMRs. Similar methods have been used earlier in Brazil and US[18-20]. We considered interrupted time series analysis and generalized linear mixed models (GLMM) as alternative analysis methods. However, it is difficult to estimate autocorrelation accurately with 9 observations per state and a Box-Ljung Q test[21] for auto-correlated errors indicated no reason for detailed time series modeling. The GLMM methods provided unacceptably large shrinkage in preliminary results wiping out between-state differences completely.
For forecasting we used simple instead of piecewise linear regression in order to limit the number of parameters. The extrapolated IMRs assume constant proportionate changes in trend for the annual IMRs from 2000 through to 2015. Since the actual IMR in 2015 is a random variable rather than a parameter, we obtain 95% reference ranges (RRs) in place of 95% CIs. We then assessed whether or not that state was ‘on track’; i.e. likely to achieve 2/3 reduction in its 1990's baseline IMR, by 2015. Where the upper end of the projected RR fell below the 2015 target IMR, we took it as a clear evidence for that state being ‘on track’. Where the lower end excluded the target IMR, we had clear evidence for the state being ‘off track’. Where the RR included the target IMR, the state was ‘potentially on track’.
Our projections were based purely on the assumption that the current IMR trends continue into the future. Given the scope of this research, no provisions were made for likely extrinsic shocks or influences of medical technology, demographic or radical behavioral or socioeconomic changes on future mortality. All statistical analyses were carried out in Statal 1 and maps were created using Arc GIS 9.2

- Map of India Showing Annual Average Reduction Rates in Infant Mortality Between 2000 and 2009. The color of state represents the AARR whereas the bars represent IMR for the period
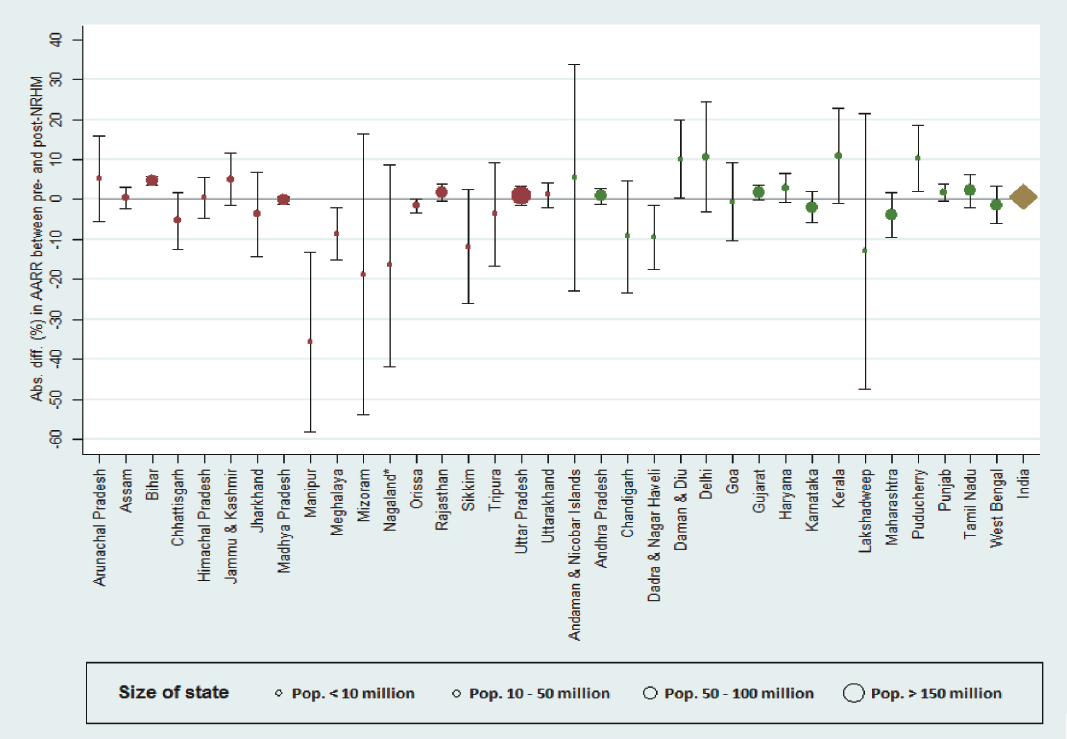
- Absolute Differences in AARR Pre- and Post-NRHM Introduction by State.
Results
India total
The total IMR in India decreased from 68 to 50 per 1000 live births between 2000 and 2009, with an AARR of 3.1% (95% CI=2.6% to 3.5%). The IMR declined with an AARR of 3.0% (95% CI =2.2% to 3.8%) during pre-NRHM era and 3.3% (95% CI=1.8% to 4.8%) in the post-NRHM era. There was no evidence that the rate of IMR reduction had increased in India after launch of NRHM (absolute difference 0.3%; p=0.71).
Rural and Urban India
Between 2000 and 2009, the IMR in urban areas declined by 21% from 43 to 34 per 1000 live births with an AARR of 2.1%, whereas in rural India it declined by 26% from 74 to 55 with an AARR of 3.0%. There is evidence that the urban-rural gap in IMR narrowed (p=0.036) with AARR in rural areas being nearly 1% times higher than urban areas. However, there was no evidence that the rate of IMR reduction in rural India post-NRHM (3.4%, 95% CI=2.0%-4.7%) was larger than the pre-NRHM rate (2.8%, 95% CI=2.1%-3.5%, p=0.71 for a difference in rates).
Overall state trends for rural IMR 2000-2009
Table 1 shows AARR figures over the ten-year period between 2000 and 2009 for total, rural and urban India, as well as for rural areas of all states in descending order of AARR. A declining IMR trend was observed in most Indian states (see web appendix). Relative declines in IMR were highest in Goa (AARR 9.1%; 95% CI=7.4 to 10.8%) and Tamil Nadu (AARR 6.5%; 95% CI =5.7% to 7.3%) for Non Focus States; Chhattisgarh (AARR 5.7%; 95% CI=4.1% to 7.2%) and Uttarakhand (AARR 5.0%; 95% CI=4.3% to 5.6%) for High Focus States. Nine states showed no clear evidence of change in IMR: Manipur, Sikkim, Arunachal Pradesh, Tripura, Meghalaya, Jammu & Kashmir, Lakshadweep, Puducherry and Kerala. There was evidence for negative AARRs in 4 states suggesting the underlying trend in IMR increased rather than decreased; by 10.4% per year (95% CI=3.1% to 18.3%) in Nagaland, 9.8% per year (95% CI=3.3% to 16.8%) in Mizoram, 6.8% (95% CI 1.4% to 12.5%) in Andaman and Nicobar islands and 3.2% (95% CI=0.0% to 6.6%) in Delhi.
| AARR | 95% CI | ||||
| India total | 3.10% | (2.6% to 3.5%) | |||
| India urban | 2.10% | (1.3% to 2.9%) | |||
| India rural | 3.00% | (2.6% to 3.4%) | |||
| High Focus States | Non Focus States | ||||
| AARR | 95% CI | AARR | 95% CI | ||
| Chhattisgarh | 5.70% | (4.1% to 7.2%) | Goa | 9.10% | (7.4% to 10.8%) |
| Uttarakhand | 5.00% | (4.3% to 5.6%) | Tamil Nadu | 6.50% | (5.7% to 7.3%) |
| Jharkhand | 4.10% | (2.3% to 5.9%) | Daman & Diu | 6.20% | (3.5% to 8.9%) |
| Orissa | 4.00% | (3.7% to 4.4%) | Dadra & Nagar Haveli | 6.20% | (4.3% to 8.1%) |
| Madhya Pradesh | 2.90% | (2.7% to 3.1%) | West Bengal | 5.10% | (4.2% to 6.0%) |
| Uttar Pradesh | 2.80% | (2.4% to 3.3%) | Maharashtra | 4.60% | (3.4% to 5.8%) |
| Himachal Pradesh | 2.70% | (1.6% to 3.7%) | Karnataka | 4.20% | (3.4% to 5.1%) |
| Rajasthan | 2.50% | (2.0% to 3.0%) | Chandigarh | 3.40% | (0.6% to 6.1%) |
| Manipur | 2.40% | (-3.7% to 8.2%) | Andhra Pradesh | 3.40% | (3.0% to 3.8%) |
| Sikkim | 2.30% | (-0.9% to 5.3%) | Lakshadweep | 3.20% | (-2.1% to 8.2%) |
| Assam | 1.90% | (1.3% to 2.4%) | Punjab | 3.00% | (2.6% to 3.5%) |
| Bihar | 1.50% | (0.6% to 2.4%) | Gujarat | 2.30% | (1.8% to 2.8%) |
| Arunachal Pradesh | 1.50% | (-0.8% to 3.7%) | Haryana | 2.20% | (1.3% to 3.1%) |
| Tripura | 1.10% | (-1.5% to 3.7%) | Puducherry | 0.50% | (-1.9% to 2.8%) |
| Meghalaya | 0.30% | (-1.6% to 2.0%) | Kerala | -0.50% | (-3.8% to 2.6%) |
| Jammu & Kashmir | -0.40% | (-1.8% to 1.0%) | Delhi | -3.20% | (-6.6% to 0.0%) |
| Mizoram | -9.80% | (-16.8% to -3.3%) | Andaman & Nicobar Islands | -6.80% | (-12.5% to -1.4%) |
| Nagaland* | -10.40% | (-18.3% to -3.1%) | |||
| Pre NRHM AARR | Post NRHM AARR | Difference | P for Difference | 95% CI | |
|---|---|---|---|---|---|
| India rural | 2.80% | 3.40% | 0.60% | 0.49 | (-1.3% to 2.4%) |
| India total | 3.00% | 3.30% | 0.30% | 0.71 | (-1.7% to 2.4%) |
| High Focus States | |||||
| Arunachal Pradesh | 0.20% | 5.30% | 5.10% | 0.3 | (-5.6% to 15.8%) |
| Jammu & Kashmir | -1.60% | 3.40% | 5.00% | 0.12 | (-1.5% to 11.5%) |
| Bihar | 0.20% | 4.80% | 4.70% | <0.001 | (3.6% to 5.7%) |
| Rajasthan | 2.10% | 3.70% | 1.60% | 0.11 | (-0.5% to 3.7%) |
| Uttarakhand | 4.60% | 5.80% | 1.20% | 0.4 | (-1.9% to 4.2%) |
| Uttar Pradesh | 2.60% | 3.50% | 0.90% | 0.4 | (-1.5% to 3.4%) |
| Himachal Pradesh | 2.50% | 3.00% | 0.50% | 0.83 | (-4.6% to 5.6%) |
| Assam | 1.70% | 2.20% | 0.50% | 0.7 | (-2.3% to 3.2%) |
| Madhya Pradesh | 2.90% | 2.80% | -0.20% | 0.63 | (-1.1% to 0.7%) |
| Orissa | 4.40% | 2.80% | -1.60% | 0.061 | (-3.2% to 0.1%) |
| Tripura | 2.10% | -1.60% | -3.70% | 0.52 | (-16.8% to 9.3%) |
| Jharkhand | 4.80% | 1.10% | -3.70% | 0.42 | (-14.3% to 6.8%) |
| Chhattisgarh | 7.00% | 1.70% | -5.30% | 0.11 | (-12.3% to 1.7%) |
| Meghalaya | 2.30% | -6.30% | -8.60% | 0.016 | (-15.2% to -2.0%) |
| Sikkim | 5.00% | -6.80% | -11.80% | 0.085 | (-26.1% to 2.5%) |
| Nagaland* | -0.50% | -17.00% | -16.50% | 0.13 | (-41.8% to 8.7%) |
| Mizoram | -5.40% | -24.20% | -18.80% | 0.23 | (-53.9% to 16.4%) |
| Manipur | 9.30% | -26.30% | -35.60% | 0.004 | (-58.0% to -13.2%) |
| Non Focus States | |||||
| Kerala | -3.70% | 7.20% | 10.90% | 0.071 | (-1.0% to 22.7%) |
| Delhi | -6.00% | 4.60% | 10.60% | 0.12 | (-3.1% to 24.4%) |
| Puducherry | -2.10% | 8.20% | 10.30% | 0.023 | (2.1% to 18.5%) |
| Daman & Diu | 3.50% | 13.60% | 10.10% | 0.048 | (0.4% to 19.8%) |
| Andaman & Nicobar Islands | -8.20% | -2.70% | 5.50% | 0.66 | (-22.8% to 33.8%) |
| Haryana | 1.30% | 4.20% | 2.90% | 0.1 | (-0.7% to 6.5%) |
| Tamil Nadu | 6.10% | 8.20% | 2.10% | 0.27 | (-2.1% to 6.4%) |
| Gujarat | 1.80% | 3.60% | 1.70% | 0.073 | (-0.2% to 3.7%) |
| Punjab | 2.60% | 4.30% | 1.70% | 0.085 | (-0.3% to 3.7%) |
| Andhra Pradesh | 3.20% | 4.00% | 0.80% | 0.35 | (-1.1% to 2.8%) |
| Goa | 9.20% | 8.70% | -0.60% | 0.9 | (-10.4% to 9.3%) |
| West Bengal | 5.50% | 4.10% | -1.40% | 0.51 | (-6.1% to 3.3%) |
| Karnataka | 4.80% | 2.80% | -2.00% | 0.27 | (-5.8% to 1.9%) |
| Maharashtra | 5.50% | 1.60% | -3.90% | 0.144 | (-9.5% to 1.8%) |
| Chandigarh | 5.50% | -3.80% | -9.30% | 0.151 | (-23.3% to 4.7%) |
| Dadra & Nagar Haveli | 8.10% | -1.40% | -9.50% | 0.025 | (-17.6% to -1.4%) |
| Lakshadweep | 5.30% | -7.70% | -13.00% | 0.38 | (-47.4% to 21.5%) |
| Year | 2000 | 2001 | 2002 | 2003 | 2004 | 2005 | 2006 | 2007 | 2008 | 2009 | ||||||||||||||||||||
|---|---|---|---|---|---|---|---|---|---|---|---|---|---|---|---|---|---|---|---|---|---|---|---|---|---|---|---|---|---|---|
| State | Total | Rural | Urban | Total | Rural | Urban | Total | Rural | Urban | Total | Rural | Urban | Total | Rural | Urban | Total | Rural | Urban | Total | Rural | Urban | Total | Rural | Urban | Total | Rural | Urban | Total | Rural | Urban |
| Andaman & Nicobar Islands | 23 | 27 | 10 | 18 | 21 | 8 | 15 | 17 | 10 | 18 | 20 | 11 | 19 | 22 | 11 | 27 | 30 | 18 | 31 | 35 | 21 | 34 | 38 | 23 | 31 | 35 | 23 | 27 | 31 | 20 |
| Andhra Pradesh | 65 | 74 | 36 | 66 | 74 | 39 | 62 | 71 | 35 | 59 | 67 | 33 | 59 | 65 | 39 | 57 | 63 | 39 | 56 | 62 | 38 | 54 | 60 | 37 | 52 | 58 | 36 | 49 | 54 | 35 |
| ArunachalPradesh | 44 | 45 | 11 | 39 | 41 | 11 | 37 | 38 | 12 | 34 | 35 | 11 | 38 | 39 | 17 | 37 | 39 | 17 | 40 | 44 | 19 | 37 | 41 | 15 | 32 | 34 | 19 | 32 | 35 | 14 |
| Assam | 75 | 78 | 35 | 73 | 76 | 33 | 70 | 73 | 38 | 67 | 70 | 35 | 66 | 69 | 38 | 68 | 71 | 39 | 67 | 70 | 42 | 66 | 68 | 41 | 64 | 66 | 39 | 61 | 64 | 37 |
| Bihar | 62 | 63 | 53 | 62 | 63 | 52 | 61 | 62 | 50 | 60 | 62 | 59 | 61 | 63 | 47 | 61 | 62 | 47 | 60 | 62 | 45 | 58 | 59 | 44 | 56 | 57 | 42 | 52 | 53 | 40 |
| Chandigarh | 28 | 38 | 26 | 24 | 28 | 23 | 21 | 25 | 21 | 19 | 25 | 18 | 21 | 25 | 20 | 19 | 25 | 18 | 23 | 23 | 23 | 27 | 25 | 28 | 28 | 22 | 29 | 25 | 25 | 25 |
| Chhattisgarh | 79 | 95 | 49 | 76 | 88 | 56 | 63 | 80 | 59 | 70 | 77 | 55 | 60 | 61 | 52 | 63 | 65 | 52 | 61 | 62 | 50 | 59 | 61 | 49 | 57 | 59 | 48 | 54 | 55 | 47 |
| Dadra & Nagar Haveli | 58 | 62 | 14 | 58 | 62 | 9 | 56 | 58 | 21 | 54 | 57 | 19 | 48 | 50 | 21 | 42 | 45 | 29 | 35 | 38 | 24 | 34 | 38 | 18 | 34 | 38 | 20 | 37 | 41 | 24 |
| Daman & Diu | 48 | 38 | 57 | 40 | 42 | 35 | 42 | 42 | 43 | 39 | 41 | 38 | 37 | 39 | 35 | 28 | 32 | 21 | 28 | 33 | 18 | 27 | 29 | 23 | 31 | 29 | 36 | 24 | 21 | 30 |
| Delhi | 32 | 32 | 32 | 29 | 34 | 28 | 30 | 31 | 30 | 28 | 32 | 28 | 32 | 48 | 30 | 35 | 44 | 33 | 37 | 42 | 36 | 36 | 41 | 35 | 35 | 40 | 34 | 33 | 40 | 31 |
| Goa | 23 | 24 | 21 | 19 | 21 | 16 | 17 | 19 | 14 | 16 | 18 | 14 | 17 | 17 | 16 | 16 | 16 | 15 | 15 | 14 | 16 | 13 | 11 | 13 | 10 | 10 | 11 | 11 | 11 | 10 |
| Gujarat | 62 | 69 | 45 | 60 | 67 | 42 | 60 | 68 | 37 | 57 | 65 | 36 | 53 | 62 | 38 | 54 | 63 | 37 | 53 | 62 | 37 | 52 | 60 | 36 | 50 | 58 | 35 | 48 | 55 | 33 |
| Haryana | 67 | 69 | 57 | 65 | 68 | 54 | 62 | 64 | 51 | 59 | 61 | 49 | 61 | 66 | 47 | 60 | 64 | 45 | 57 | 62 | 45 | 55 | 60 | 44 | 54 | 58 | 43 | 51 | 54 | 41 |
| Himachal Pradesh | 60 | 62 | 37 | 54 | 55 | 32 | 52 | 53 | 28 | 49 | 51 | 26 | 51 | 53 | 23 | 49 | 50 | 20 | 50 | 52 | 26 | 47 | 49 | 25 | 44 | 45 | 27 | 45 | 46 | 28 |
| Jammu & Kashmir | 50 | 51 | 45 | 48 | 50 | 39 | 45 | 47 | 34 | 44 | 46 | 32 | 49 | 51 | 37 | 50 | 53 | 39 | 52 | 54 | 38 | 51 | 53 | 38 | 49 | 51 | 37 | 45 | 48 | 34 |
| Jharkhand | 70 | 74 | 48 | 62 | 67 | 40 | 51 | 55 | 33 | 51 | 54 | 34 | 49 | 51 | 34 | 50 | 53 | 33 | 49 | 52 | 32 | 48 | 51 | 31 | 46 | 49 | 32 | 44 | 46 | 30 |
| Kerala | 14 | 14 | 14 | 11 | 12 | 9 | 10 | 11 | 8 | 11 | 12 | 10 | 12 | 13 | 9 | 14 | 15 | 12 | 15 | 16 | 12 | 13 | 14 | 10 | 12 | 12 | 10 | 12 | 12 | 11 |
| Karnataka | 57 | 68 | 24 | 58 | 69 | 27 | 55 | 65 | 25 | 52 | 61 | 24 | 49 | 54 | 38 | 50 | 54 | 39 | 48 | 53 | 36 | 47 | 52 | 35 | 45 | 50 | 33 | 41 | 47 | 31 |
| Lakshadweep | 27 | 25 | 29 | 33 | 34 | 33 | 25 | 31 | 18 | 26 | 31 | 21 | 30 | 24 | 37 | 22 | 17 | 27 | 25 | 19 | 31 | 24 | 25 | 23 | 31 | 28 | 35 | 25 | 22 | 28 |
| Maharashtra | 48 | 57 | 33 | 45 | 55 | 27 | 45 | 52 | 34 | 42 | 48 | 32 | 36 | 42 | 27 | 36 | 41 | 27 | 35 | 42 | 26 | 34 | 41 | 24 | 30 | 40 | 23 | 31 | 37 | 22 |
| Meghalaya | 58 | 61 | 32 | 56 | 57 | 41 | 61 | 62 | 49 | 57 | 59 | 44 | 54 | 55 | 43 | 49 | 50 | 42 | 53 | 54 | 43 | 56 | 57 | 46 | 58 | 60 | 43 | 59 | 61 | 40 |
| Mizoram | 21 | 24 | 15 | 19 | 23 | 12 | 14 | 14 | 14 | 16 | 18 | 14 | 19 | 23 | 13 | 20 | 26 | 10 | 25 | 32 | 13 | 23 | 27 | 16 | 37 | 45 | 24 | 36 | 45 | 19 |
| Manipur | 22 | 23 | 25 | 20 | 119 | 23 | 14 | 12 | 21 | 16 | 15 | 19 | 14 | 13 | 19 | 13 | 12 | 14 | 11 | 11 | 11 | 12 | 13 | 9 | 14 | 16 | 8 | 16 | 18 | 11 |
| Madhya Pradesh | 88 | 94 | 54 | 86 | 92 | 53 | 85 | 89 | 56 | 82 | 86 | 55 | 79 | 84 | 56 | 76 | 80 | 54 | 74 | 79 | 52 | 72 | 77 | 50 | 70 | 75 | 48 | 67 | 72 | 45 |
| Nagaland | . | . | 23 | . | . | 13 | . | . | 20 | . | . | 16 | 17 | 17 | 16 | 18 | 17 | 22 | 20 | 13 | 27 | 21 | 18 | 29 | 26 | 25 | 28 | 26 | 27 | 23 |
| Orissa | 96 | 99 | 66 | 90 | 94 | 60 | 87 | 90 | 56 | S3 | 86 | 55 | 77 | 80 | 58 | 75 | 78 | 55 | 73 | 76 | 53 | 71 | 73 | 52 | 69 | 71 | 49 | 65 | 68 | 46 |
| Puducherry | 23 | 33 | 15 | 22 | 31 | 15 | 22 | 29 | 17 | 24 | 33 | 17 | 24 | 33 | 19 | 28 | 38 | 22 | 28 | 35 | 24 | 25 | 31 | 22 | 25 | 31 | 22 | 22 | 28 | 19 |
| Punjab | 52 | 56 | 38 | 51 | 55 | 37 | 51 | 55 | 35 | 49 | 53 | 34 | 45 | 50 | 36 | 44 | 49 | 37 | 44 | 48 | 38 | 43 | 47 | 35 | 41 | 45 | 33 | 38 | 42 | 31 |
| Rajasthan | 79 | 83 | 58 | 79 | 83 | 57 | 78 | 81 | 55 | 75 | 78 | 53 | 67 | 74 | 43 | 68 | 75 | 43 | 67 | 74 | 41 | 65 | 72 | 40 | 63 | 69 | 38 | 59 | 65 | 35 |
| Sikkim | 49 | 49 | 36 | 42 | 43 | 31 | 34 | 34 | 25 | 33 | 33 | 23 | 32 | 33 | 20 | 30 | 31 | 15 | 33 | 35 | 16 | 34 | 36 | 20 | 33 | 35 | 19 | 34 | 36 | 21 |
| Tamil Nadu | 51 | 57 | 38 | 49 | 54 | 35 | 44 | 50 | 32 | 43 | 48 | 31 | 41 | 45 | 35 | 37 | 39 | 34 | 37 | 39 | 33 | 35 | 38 | 31 | 31 | 34 | 28 | 28 | 30 | 26 |
| Tripura | 41 | 42 | 32 | 39 | 40 | 30 | 34 | 35 | 32 | 32 | 32 | 31 | 32 | 33 | 29 | 31 | 31 | 29 | 36 | 37 | 30 | 39 | 40 | 32 | 34 | 36 | 26 | 31 | 33 | 20 |
| Uttarakhand | 50 | 73 | 26 | 48 | 69 | 26 | 41 | 62 | 21 | 41 | 62 | 21 | 42 | 57 | 22 | 42 | 56 | 19 | 43 | 54 | 22 | 48 | 52 | 25 | 44 | 48 | 28 | 41 | 44 | 27 |
| Uttar Pradesh | 83 | 87 | 65 | 82 | 86 | 62 | 80 | 83 | 58 | 76 | 79 | 55 | 72 | 75 | 53 | 73 | 77 | 54 | 71 | 75 | 53 | 69 | 72 | 51 | 67 | 70 | 49 | 63 | 66 | 47 |
| West Bengal | 51 | 54 | 37 | 51 | 53 | 38 | 49 | 52 | 36 | 46 | 48 | 34 | 42 | 42 | 32 | 38 | 40 | 31 | 38 | 40 | 29 | 37 | 39 | 29 | 35 | 37 | 29 | 33 | 34 | 27 |
| India | 68 | 74 | 43 | 66 | 72 | 42 | 63 | 69 | 40 | 60 | 66 | 38 | 58 | 64 | 40 | 58 | 64 | 40 | 57 | 62 | 39 | 55 | 61 | 37 | 53 | 58 | 36 | 50 | 55 | 34 |
* Data Source: Sample Registration System, India
*IMR data seggregared byurban-rural not available for Nagaland from yrs 2000-03
*IMR data is expressed per 1000 live births
There was no clear evidence for a change in trend in all except two states; for Bihar AARR increased by 4.7% from 0.2% pre-NRHM to 4.8% post-NRHM (p<0.001; 95% CI=3.6% to 5.7%) and for Manipur AARR reversed from an annual reduction of 9.3% to an annual increase in IMR of 26.3% post-NRHM (p=0.004; 95% CI= 13.2% to 58.0%). For three states, we found weak evidence for a difference; the estimated trend in IMR in Meghalaya was an annual decrease of 2.3% during the pre-NRHM era and -6.3% post-NRHM (p=0.016; 95% CI for difference = -15.2% to -2.0%), for Puducherry the AARR changed from -2.1% during the pre-NRHM era to 8.2% post-NRHM (p=0.023; 95% CI=2.I% to I8.5%), for Daman and Diu from 3.5% to I3.6% (p=0.048; 95% CI=0.4% to 19.8%) and for Dadra & Nagar Haveli from 8.1% to -1.4% (p=0.025; 95% CI=-17.6% to -1.4%).
Projections
Table 3/Figure 6 shows projected national and state-level IMR figures for 20I5. India appears unlikely to achieve either the NRHM goal of reducing IMR to 30 by 20I2 or MDG4 of reducing IMR to 27/1000 live births by 2015. The predicted total IMR for 2015 is 47 (95% RR=40 to 46) -74% higher than the target. In order to achieve MDG4, an AARR of 9.9% is needed between 2009 and 20I5, which is more than triple the AARR of 3.1% between 2000 and 2009.

- Statewise Projected Total IMRs and Reference Ranges (Brown lines for High Focus, Blue dotted lines for Non-Focus states) in 2015 against the Baseline IMR of 1990. The irregular diagonal line represents Two-third reduction cutoff and states with Reference ranges falling on or below this cutoff line are likely to achieve MDG4.
| IMR 1990 | IMR 2009 | Projectd IMR 2015 | Projectd IMR 95% RR | Target IMR 2015 | On Track? | Required AARR | 2000-2009 Trend | |
|---|---|---|---|---|---|---|---|---|
| India total | 80 | 50 | 47 | (40 to 46) | 27 | No | 9.90% | 3.10% |
| India rural | 86 | 54 | 42 | (45 to 51) | 29 | No | 10.00% | 3.00% |
| India urban | 50 | 34 | 31 | (29 to 36) | 17 | No | 11.20% | 2.10% |
| High Focus States | ||||||||
| Nagaland* | - | - | - | - | - | - | - | - |
| Madhya Pradesh | 111 | 67 | 56 | (54 to 58) | 37 | No | 9.40% | 2.90% |
| Assam | 76 | 61 | 56 | (51 to 61) | 25 | No | 13.60% | 1.90% |
| Meghalaya | 54.3 | 59 | 55 | (43 to 69) | 18 | No | 17.90% | 0.30% |
| Uttar Pradesh | 99 | 63 | 54 | (51 to 57) | 33 | No | 10.20% | 2.80% |
| Mizoram | 15 | 36 | 51 | (24 to 109) | 5 | No | 28.00% | -9.80% |
| Orissa | 122 | 65 | 51 | (47 to 54) | 41 | No | 7.50% | 4.00% |
| Bihar | 75 | 52 | 50 | (45 to 56) | 25 | No | 11.50% | 1.50% |
| Jammu & Kashmir | 45 | 45 | 49 | (40 to 61) | 15 | No | 16.70% | -0.40% |
| Rajasthan | 84 | 59 | 49 | (45 to 54) | 28 | No | 11.70% | 2.50% |
| Chhattisgarh | 111 | 54 | 43 | (35 to 53) | 37 | Maybe | 6.10% | 5.70% |
| Uttarakhand | 99 | 41 | 40 | (31 to 52) | 33 | Maybe | 3.60% | 5.00% |
| Himachal Pradesh | 68 | 45 | 37 | (33 to 43) | 23 | No | 10.70% | 2.70% |
| Jharkhand | 75 | 44 | 34 | (26 to 44) | 25 | No | 9.00% | 4.10% |
| Tripura | 43 | 31 | 30 | (21 to 42) | 14 | No | 12.10% | 1.10% |
| Arunachal Pradesh | 63 | 32 | 29 | (22 to 38) | 21 | No | 6.80% | 1.50% |
| Sikkim | 37 | 34 | 25 | (17 to 39) | 12 | No | 15.50% | 2.30% |
| Manipur | 23 | 16 | 9 | (5 to 18) | 8 | Maybe | 11.50% | 2.40% |
| Non Focus States | ||||||||
| Andaman & Nicobar Islands | 30 | 27 | 48 | (23 to 100) | 10 | No | 15.30% | -6.80% |
| Haryana | 69 | 51 | 44 | (41 to 48) | 23 | No | 12.40% | 2.20% |
| Andhra Pradesh | 70 | 49 | 42 | (39 to 45) | 23 | No | 11.60% | 3.40% |
| Gujarat | 72 | 48 | 41 | (38 to 44) | 24 | No | 10.90% | 2.30% |
| Delhi | 43 | 33 | 41 | (31 to 53) | 14 | No | 13.10% | -3.20% |
| Karnataka | 70 | 41 | 35 | (31 to 38) | 23 | No | 9.00% | 4.20% |
| Punjab | 61 | 38 | 32 | (29 to 35) | 20 | No | 9.90% | 3.00% |
| Puducherry | 31 | 22 | 27 | (20 to 37) | 10 | No | 11.80% | 0.50% |
| Chandigarh | 32 | 25 | 26 | (15 to 45) | 11 | No | 13.20% | 3.40% |
| West Bengal | 63 | 33 | 24 | (21 to 27) | 21 | No | 7.30% | 5.10% |
| Lakshadweep | 27 | 25 | 24 | (15 to 38) | 9 | No | 15.70% | 3.20% |
| Maharashtra | 58 | 31 | 22 | (19 to 25) | 19 | Maybe | 7.60% | 4.60% |
| Dadra & Nagar Haveli | 78 | 37 | 21 | (15 to 29) | 26 | Maybe | 5.70% | 6.20% |
| Tamil Nadu | 59 | 28 | 20 | (18 to 23) | 20 | Maybe | 5.70% | 6.50% |
| Daman & Diu | 43 | 24 | 16 | (11 to 23) | 14 | Maybe | 8.20% | 6.20% |
| Kerala | 17 | 12 | 14 | (9 to 22) | 6 | No | 11.80% | -0.50% |
| Goa | 21 | 11 | 7 | (5 to 9) | 7 | Maybe | 7.30% | 9.10% |
1990 IMRs for states with figures in brown were extrapolated using 1992-1994 figures as 1990 figures were unavailable.
Baseline IMRs for Madhya Pradesh, Bihar and Uttar Pradesh were used for Chhattisgarh, Jharkhand and Uttarakhand respectively as the latter states were carved out of the former.
* No projections done for Nagaland due to insufficient data.
At the state-level, no state was clearly 'on track' for 2/3 reduction in IMR compared to the 1990 baseline by 20I5; Dadra & Nagar Haveli, Tamil Nadu, Maharashtra, Chhattisgarh, Uttarakhand, Jharkhand, Manipur and Daman & Diu are 'potentially on track'. The remaining states were 'off track'. For detailed figures, please refer to Table 3.
Discussion
Our analysis showed that India's IMR in rural areas declined with an AARR of 3.0% between 2000 and 2009, significantly higher than the AARR of 2.I% in urban India. There was evidence suggesting that the nation-wide urban-rural gap in IMR has narrowed over this period. However, we found no evidence to suggest that the AARR at both the rural or national level had increased after the launch of NRHM in comparison to the AARR of the pre-NRHM era. Our projections of IMR suggested that despite good progress in some states, India is unlikely to achieve child health related NRHM or Millennium Development Goals.
A recent multinational study[22] suggested similar findings for India's country level child mortality trends. The persistent decline in infant mortality rates over the past decade may be attributed to economic growth, better living standards, improved drinking water sources and sanitation facilities[23], increased maternal literacy rates and availability and utilization of healthcare services[24-26]. However, there were considerable variations at state level. The increasing IMR trends in Mizoram and Nagaland and stagnation in Jammu and Kashmir may be explained by ongoing political instability, which could have led to disruption of healthcare and other public services. Kerala on the other hand already had low IMR and further decline would need substantial efforts. However, there was no clear explanation for other states, for example, the increasing IMR trends in Andaman & Nicobar and Delhi.
Claeson et al. quoted a narrowing urban-rural gap in IMR for I990-2000[27]; we found strong evidence that this trend continued in the following years. This tapering might be explained by greater proportionate increase in standards of living, literacy rates, and utilization of MCH services in rural areas[24-26]; whereas, owing to high migration, the number of urban poor living under unhygienic and crowded conditions has grown[28,29]. The higher IMR in these populations might be diluting the overall AARR for urban India. The AARR in IMR at state level did not show clear evidence of change except in Bihar, where it increased by 4.7 percentage points and Manipur where it decreased by 35.6 percentage points. However, it would be premature to attribute this to NRHM and will require further analysis of contributing factors. Note that Manipur had already achieved quite low IMRs and hence small absolute changes in IMR could have resulted in large relative shifts.
Despite apparent increases in service provision, delivery and utilization since launch of NRHM, we found no evidence for an increase in the rate of IMR reduction. A few possible explanations:
Firstly, healthcare alone does not exclusively determine infant mortality[30]. At the same time, access to and utilization of healthcare does not guarantee quality and equity[31]. The utilization of reproductive and child health services historically has stayed at a low level amongst the poorest wealth quintile[23,32], which has the highest infant mortality[23,33]. There is a possibility of continuing inadequate access and utilization by these groups, even post NRHM. Lim et al.'s evaluation of the NRHM's JSY (conditional cash transfer scheme) also suggested that the poorest and the least educated women had the lowest odds of receiving payments[35]. Secondly, problems were reported with regards to scale-up of NRHM across states, inadequacies in human resources & infrastructure, poor convergence, lack of community participation and funds flow mismanagement[14]. Gaps in the health budget[34], operational issues[35,36] and lack of public health capacity in India[37,38] could have had detrimental effects on roll out, implementation and management of this huge program. Finally, a longer time lag may be required to observe the effects of NRHM; however, cluster randomized control trials in high burden states of India using community based approaches analogous to NRHM strategies, have shown large reductions in infant and neonatal mortality over a period of two-three years[39-41].
Our projections for India's likelihood of achieving MDG4 were similar to WHO's report which suggests ‘insufficient progress’[42]. Another study made similar projections for 2003 to 2015[43]. The projections showed a clear need to increase AARR in all except eight states. The High Focus States of UP Bihar, Madhya Pradesh, Rajasthan and Orissa will have to increase AARRs by 2 to 7-fold. Pregress in these states will play a crucial role in India's endeavor to achieve MDG4, since they share two thirds of all infant deaths.
Limitations
We only used data from India's Sample Registration System (SRS). However, validity assessments have shown that surveys may underestimate neonatal deaths[44]. Any errors in SRS data could have led to over-or underestimation of AARRs and IMR projections. For evaluating progress towards MDG4, IMR was used as a proxy for U5MR. Hence, we advise interpreting the figures for ‘required AARR’ with care; U5MR may not decline at proportionate rates to IMR, between 2010 and 2015. In addition, we note a few statistical points. Large numbers of tests have inflated type I error; p-values near 0.05 should be considered weak, suggestive evidence. Bonferroni correction suggests p<0.0014 provides strong evidence, but this is not a strict law. Further, we assumed a piecewise linear dependency of log IMR on time correctly modeled the underlying trend of IMRs. For states with complex trend patterns (Andaman and Nicobar, Delhi, Jammu and Kashmir, Kerala, Lakshadweep and Mizoram) lower significance provided an adjustment for the lack of fit, but this adjustment was not rigorous. Finally, for some of the states, we got wide CIs/RRs. We believe this reflected genuine uncertainty due to measurement error and large state-level variability in IMR across time.
Conclusions and Public Health Implications
There were wide differences in the AARRs of various states underpinning varied levels of progress. However, there was clear evidence of increasing IMR trends in some states and UTs; the central and governments of high Focus North Eastern states need to closely monitor the program implementation while maintaining high levels of commitment and ownership. We specifically recommend assessing the equity of access and utilization of NRHM services. This needs to be followed up by strengthening of the mechanisms to ensure that quality services are available and accessible to the most needy and vulnerable groups. In general, we note that Manipur, Goa, Dadra and Nagar Haveli, Tamil Nadu and Maharashtra are likely on target to help India achieve MDG4. While socioeconomic and political factors probably played an important role in the progress of these states, it would also be worth exploring the role of governance, specific strategies and health delivery systems in these states. Best practices and lessons learnt can be extrapolated to other states after assessing local capacity and needs. Similarly, it would be pertinent to investigate the reasons contributing to Bihar's success in accelerating child survival post-NRHM introduction. This study provides insight into state level IMR trends for recent years. Similarly, it explores the effectiveness of NRHM in terms of impact rather than output indicators which were previously unavailable. It will enable policy makers and health care providers to allocate resources efficiently and fine-tune prioritization of states. The study provides a basis for hypothesis formulation that may subsequently be tested in future evaluations thus improving operationalization of NRHM and eventually child survival.
Acknowledgements:
The authors acknowledge the technical insights and suggestions provided by Drs. Betty Kirkwood (LSHTM), David Osrin (UCL) and Simon Cousens (LSHTM) in conducting and writing of this research
References
- Under 5 Mortality Rankings. 2011. State of World's Children. Available from: http://www.unicef.org/sowc20ll/pdfs/SOWC-2011-Statistical-tables_12082010.pdf (accessed )
- [Google Scholar]
- Evidence-based, cost-effective interventions: how many newborn babies can we save? The Lancet. 2005;365(9463):977-88.
- [CrossRef] [PubMed] [Google Scholar]
- How many child deaths can we prevent this year? The Lancet. 2003;362(9377):65-71.
- [CrossRef] [PubMed] [Google Scholar]
- International Institute of Population Sciences (IIPS), National Family Health Survey-1 (MCH and Family Planning), India, 1992-93,1995, Indian Institute of Population Sciences.
- [Google Scholar]
- IIPS and ORC Macro, National Family Health Survey (NFHS-2) 1998-99,. In: International Institute of Population Sciences. 2000.
- [Google Scholar]
- IIPS and Macro International, National Family Health Survey (NFHS-3), 2005-06,. In: International Institute of Population Sciences. 2007.
- [Google Scholar]
- India launches national rural health mission. British Medical Journal. 2005;330(7497):920.
- [CrossRef] [PubMed] [Google Scholar]
- Executive summary. All india Summary of NRHM 2010. Available from: http://mohfw.nic.in/NRHM/Documents/Executive_summery_March10.pdf (accessed )
- [Google Scholar]
- Making a difference everywhere, in Four Years of NRHM 2005-2009. National Rural Health Mission 2009
- [Google Scholar]
- Implementation of NRHM - An Initial Review. Published by: Development Alternatives New Delhi; 2007.
- [Google Scholar]
- A primary evaluation of service delievery under the National Rural Health Mission: Findings from a study in Andhra Pradesh, UP, Bihar and Rajasthan. Planning Commission of India-Working paper 2009
- [Google Scholar]
- Performance Audit of NRHM: 2005 - 2008, C.a.A.G.o. India. Union Audit Reports, Union Government Civil, New Delhi 2009
- [Google Scholar]
- Sample Registration System Bulletins. 2010. Available from: http://www.censusindia.gov.in/vital_statistics/SRS_Bulletins/Bulletins.aspx (accessed )
- [Google Scholar]
- Completeness of India's Sample Registration System: An assessment using the general growth balance method. Population Studies: A Journal of Demography. . 2002;56(2):119-134.
- [CrossRef] [PubMed] [Google Scholar]
- A Note on the Delta Method. 1992. The American Statistician. 46:3. URL: http://www.jstor.org/stable/2684406 (accessed )
- [CrossRef] [Google Scholar]
- Infant mortality in the United States: trends, differentials, and projections, 1950 through 2010. American Journal of Public Health. 1995;85(7):957-64.
- [CrossRef] [PubMed] [Google Scholar]
- Time-trends and causes of infant, neonatal and postneonatal mortality in Mexico, 1980-1990. Salud Publica de Mexico. 1997;39(1):48-52.
- [CrossRef] [PubMed] [Google Scholar]
- Analysis of interrupted time series mortality trends: an example to evaluate regionalized perinatal care. American Journal of Public Health. 1981;71(1):38-46.
- [CrossRef] [PubMed] [Google Scholar]
- Measure of a Lack of Fit in Time Series Models. Biometrika. 1978;65:297-303.
- [CrossRef] [Google Scholar]
- Neonatal, postneonatal, childhood, and under-5 mortality for 187 countries, 1970-2010: a systematic analysis of progress towards Millennium Development Goal 4. The Lancet. 2010;375(9730):1988-2008.
- [CrossRef] [PubMed] [Google Scholar]
- India: Country Health Profile. 2010. Available from: http://www.who.int/gho/countries/ind.pdf (accessed )
- [Google Scholar]
- 11 PS, DLHS-2, District Level Household Survey-2 (2002-03), in Reproductive and Child Health. International Institute of Population Sciences- Mumbai 2006
- [Google Scholar]
- IIPS, DLHS-3, District level Household Survey-3 (2007-08), 2009, International Institute of population Sciences- Mumbai: New Delhi.
- [Google Scholar]
- IIPS, DLHS-1, District Level Househild Survey-1 (1998-99), in Reproductive and Child Health Project 2001, International Institute of Population Sciences.
- [Google Scholar]
- Reducing child mortality in India in the new millennium. Bulletin of World Health Organization. 2000;78(10):1192-9.
- [Google Scholar]
- Need for dedicated focus on urban health within National Rural Health Mission. Indian Journal of Public Health. 2005;49(3):141-51.
- [Google Scholar]
- Health issues sidelined in India's general election. The Lancet. 2009;373(9674):1509-11.
- [CrossRef] [PubMed] [Google Scholar]
- Determinants of mortality. The Journal of Economic Perspectives. 2006;20(3):97-120.
- [CrossRef] [Google Scholar]
- Differentials in the quality of antenatal care in India. International Journal of Quality in Health Care. 2008;20(1):62-71.
- [CrossRef] [PubMed] [Google Scholar]
- Rich-poor gap in utilization of reproductive and child health services in India, 1992-2005. Journal of Biosocial Sciences. 2009;41(3):381-98.
- [CrossRef] [PubMed] [Google Scholar]
- How does progress towards the child mortality millennium development goal affect inequalities between the poorest and least poor? Analysis of Demographic and Health Survey data. British Medical Journal. 2005;331(7526):1180-2.
- [CrossRef] [PubMed] [Google Scholar]
- Budget India 2008: what is new for health sector. Indian Pediatrics. 2008;45(5):399-400.
- [Google Scholar]
- Current status of national rural health mission. Indian Journal of Community Medicine. 2007;32:171-2.
- [CrossRef] [Google Scholar]
- National rural health mission: time to take stock. Indian Jpurnal of Community Medicine. 2009;34(3):175-82.
- [CrossRef] [PubMed] [Google Scholar]
- Empowering health personnel for decentralized health planning in India: The Public Health Resource Network. Human Resources for Health. 2009;7:57.
- [CrossRef] [PubMed] [Google Scholar]
- Distortion of some of the basic principles of public health practice in India. International Journal of Health Services. 2006;36(3):623-9.
- [CrossRef] [PubMed] [Google Scholar]
- Reduction in pneumonia mortality and total childhood mortality by means of community-based intervention trial in Gadchiroli, India. The Lancet. 1990;336(8709):201-6.
- [CrossRef] [PubMed] [Google Scholar]
- Effect of community-based behaviour change management on neonatal mortality in Shivgarh, Uttar Pradesh, India: a cluster-randomised controlled trial. The Lancet. 2008;372(9644):1151-62.
- [CrossRef] [PubMed] [Google Scholar]
- Effect of a participatory intervention with women's groups on birth outcomes and maternal depression in Jharkhand and Orissa, India: a cluster-randomised controlled trial. The Lancet. 2010;375(9721):1182-92.
- [CrossRef] [PubMed] [Google Scholar]
- WHO and UNICEF, Taking stock of maternal, newborn and child survival, in Countdown to 2015, Decade Report (2000-2010) 2010. In: World Health Organization.
- [Google Scholar]
- Components of under five mortality trends, current stagnation and future forecasting levels. National Comission on Macroeconomics and Health, Background Papers- Burden of Disease in India 2005:170-178.
- [Google Scholar]