Translate this page into:
Inequalities in Life Expectancy and All-Cause Mortality in the United States by Levels of Happiness and Life Satisfaction: A Longitudinal Study
*Corresponding author email: hyunjung.lee0001@gmail.com
-
Received: ,
Accepted: ,
This is an open-access article distributed under the terms of the Creative Commons Attribution License (CC BY 4.0) which permits unrestricted use, distribution, and reproduction in any medium, provided the original work, first published in this journal, is properly cited
Abstract
Background:
Despite having one of the highest Gross Domestic Product (GDP) per capita levels, United States (US) ranks lower in subjective well-being, including happiness and life satisfaction, compared with European countries. Studies of the impact of happiness and life satisfaction on life expectancy and mortality in the US are limited or non-existent. Using a national longitudinal dataset, we examined the association between levels of happiness/life satisfaction and US life expectancy and all-cause mortality.
Methods:
We analyzed the 2001 National Health Interview Survey (NHIS) prospectively linked to 2001-2014 mortality records in the National Death Index (NDI) (N=30,377). Cox proportional hazards regression was used to model survival time as a function of happiness, life satisfaction, and sociodemographic and behavioral covariates.
Results:
Life expectancies at age 18 among adults with high levels of happiness and life satisfaction were, respectively, 7.5 and 8.9 years higher compared to those with low levels of happiness and life satisfaction. In Cox models with 14 years of mortality follow-up, all-cause mortality risk was 82% higher (hazard ratio [HR]=1.82; 95% CI=1.59,2.08) in adults with little or no happiness, controlling for age, and 36% higher (HR=1.36; 95% CI=1.17,1.57) in adults with little/no happiness, controlling for sociodemographic, behavioral and health characteristics, when compared with adults reporting happiness all of the time. Mortality risk was 107% higher (HR=2.07; 95% CI=1.80,2.38) in adults who were very dissatisfied with their life, controlling for age, and 39% higher (HR=1.39; 95% CI=1.20,1.60) in adults who were very dissatisfied, controlling for all covariates, when compared with adults who were very satisfied.
Conclusions and Global Health Implications:
Adults with higher happiness and life satisfaction levels had significantly higher life expectancy and lower all-cause mortality risks than those with lower happiness and satisfaction levels. These findings underscore the significance of addressing subjective well-being in the population as a strategy for reducing all-cause mortality.
Keywords
Inequalities
Disparities
Happiness
Life satisfaction
Life expectancy
Mortality
Longitudinal
Social determinants

1. Introduction
According to the World Happiness Report, United States (US) ranked 18th in the level of happiness among 153 countries during 2015-2017.1 While its Gross Domestic Product (GDP) per capita ranked 9th highest among 149 countries, the US has a lower average life satisfaction and a more unequal distribution of happiness than European countries which have a lower GDP per capita than the US.1 Both happiness and life satisfaction are aspects of subjective well-being.2 Happiness reflects experience of positive feelings, referred to as affective well-being, and life satisfaction presents individual judgements about the quality of their lives, referred to as evaluative well-being.2 Happiness and life satisfaction have long been shown as protective factors for physical health, morbidity, and mortality.2–9 A meta-analysis of 90 studies found that subjective well-being, including happiness and life satisfaction, was associated with a decreased risk of mortality.10 Men with greater subjective well-being show a slightly greater decrease in mortality risk than women.10 Despite the well-established morbidity studies, the association between subjective well-being and mortality has been inconsistent. For example, two recent studies found no statistically significant association between happiness and all-cause mortality.11,12
To our knowledge, no prior studies, including those in the US, have analyzed variations in life expectancy by levels of happiness and life satisfaction, using longitudinal cohort data. To address this gap in research, we examine the association between happiness/life satisfaction and life expectancy and all-cause mortality in the US, using a nationally representative longitudinal dataset with 14-years of mortality follow-up data and baseline happiness and life satisfaction measures. Specifically, we address the following research questions:
-
How do all-cause mortality rates and risks vary in relation to different levels of happiness and life satisfaction?
-
To what extent do life expectancy and all-cause mortality vary by happiness and life satisfaction among males and females?
-
To what extent do socioeconomic and demographic factors such as education, income/poverty level, housing tenure, race/ethnicity, nativity/immigrant status, marital status, and social support account for the relationship between happiness/life satisfaction and all-cause mortality?
-
Does controlling for sociodemographic, health status, and health-risk factors, such as smoking, obesity, and alcohol consumption account for the excess all-cause mortality associated with low levels of happiness and life satisfaction?
2. Methods
2.1. Data
The data source for this study was the 2001 National Health Interview Survey (NHIS) prospectively linked to the National Death Index (NDI).13 As a nationally representative, cross-sectional household interview survey, NHIS provides demographic, socio-economic, and health characteristics for the civilian, non-institutionalized population of the US. The National Center for Health Statistics (NCHS) developed public-use versions of NHIS linked with death certificate records from the NDI. We used the public-use linked mortality file, including the mortality follow-up data from the date of survey participation in 2001 through December 31, 2014.14
2.2. Sample
The study sample was restricted to adults aged 18 years and older in the 2001 NHIS sample adult file. The sample ineligible for mortality follow-up was eliminated from the analysis. The final pooled eligible sample size without missing values was 30,377. Missing data in covariates, ranging from 0 to 448, were excluded from the analysis but used for weights, using the Stata svy, subpop option. For missing values for poverty status (21.67%), alcohol consumption (1.63%), and social support (1.76%), we created missing covariate categories to prevent omission of many observations from the analysis.
2.3. Measurement
We examined two outcomes, life expectancy and all-cause mortality. Follow-up time for individuals who died was defined by the number of months from the month/year of interview to the month/year of death. Since NHIS-NDI provides only the quarter of death, we assumed that death occurred in the middle month of the quarter, February, May, August, or November.15
2.4. Happiness and Life Satisfaction
The independent variables were happiness and life satisfaction. The level of happiness was measured by responses to the question, “During the past 30 days, how often did you feel happy?” Happiness was categorized by none or a little of the time, some of the time, most of the time, and all of the time. Life satisfaction was measured by responses to the question, “In general, how satisfied are you with your life?” Life satisfaction was categorized by very dissatisfied or dissatisfied, satisfied, and very satisfied.
2.5. Covariates
Based on the previous literature, we selected the following covariates in adjusted models: age, gender, race/ethnicity, nativity/immigrant status, marital status, social support, education, poverty status, homeownership, region, activity limitation, body mass index (BMI), smoking status, and alcohol consumption.3
2.6.Analytic Approach
We computed age-adjusted mortality rates per 100,000 person-years of exposure by happiness and life satisfaction level and other covariates. In computing person-years for age-specific and age-adjusted mortality rates, deaths were assumed to occur uniformly throughout the follow-up period rather than being clustered in the first part of the period. We used the direct standardization method for age adjustment using the age distribution of the 2000 US Standard Population. Rate ratios and 95% confidence intervals (CIs) were used to compare mortality rates for categorical variables. We used the standard life table methodology to calculate life expectancy at age 18 and subsequent ages along with standard errors.16 Specifically, life expectancy was estimated by converting age-specific mortality rates (for 14 age groups: 18-24, 25-29, 30-34, 35-39, 40-44, 45-49, 50-54, 55-59, 60-64, 65-69, 70-74, 75-79, 80-84, and ≥85 years) into life-table probabilities of dying. We tested for differences in life expectancy estimates by happiness/life satisfaction levels across gender and age groups.
Cox proportional hazards regression models were used to derive relative risks of mortality, controlling for individual characteristics. The model assumes that hazard rates are a log-linear function of parameter for the effects of covariates.17,18 Individuals surviving beyond the follow-up period were treated as right-censored observations.
Complex survey design procedures were used to account for clustering, multiple stages of selection, and disproportionate sampling. To correct the bias from the ineligible adults for linkage to the NDI due to insufficient identifying data, we used eligibility-adjusted weights developed by NCHS, instead of the standard sample weight.19 All analyses were conducted by Stata 15.20
3. Results
3.1. Descriptive Statistics
Table 1 provides descriptive statistics of individual characteristics for adults aged ≥18 years. Approximately 4.4% of the sample responded that they felt happy none or a little of the time during the past 30 days. About 5.9% of the sample responded that they were very dissatisfied or dissatisfied with their life in general. The mean age was 44.9 years. The study sample consisted of more females (52.1%), non-Hispanic Whites (73.9%), US-born adults (86.4%), high school graduates (31.6%), currently married (58.5%), adults with incomes at or above 400% of the poverty threshold (31.9%), homeowners (70.5%), Southern residents (37.2%), adults without activity limitation (85.2%), adults with BMI ≤ 25 (40.4%), non-smokers (54.6%), and current drinkers (62.8%).
| Characteristics | Mean (SE) |
|---|---|
| Sample size | 30,377 |
| Number of death (persons) | 5,311 |
| Individual characteristics (%) | |
| Mean age (years) | 44.91 (0.15) |
| Happiness | |
| None of the time/ a little of the time | 4.38 (0.14) |
| Some of the time | 16.76 (0.26) |
| Most of the time | 62.62 (0.35) |
| All of the time | 16.24 (0.29) |
| Life satisfaction | |
| Very dissatisfied or dissatisfied | 5.88 (0.15) |
| Satisfied | 50.08 (0.36) |
| Very satisfied | 44.04 (0.38) |
| Social support | |
| Never/rarely | 5.44 (0.16) |
| Sometimes | 12.17 (0.21) |
| Usually | 34.33 (0.34) |
| Always | 47.42 (0.36) |
| Missing | 0.63 (0.06) |
| Sex | |
| Male | 47.88 (0.33) |
| Female | 52.12 (0.33) |
| Race/ethnicity | |
| Non-Hispanic White | 73.89 (0.43) |
| Non-Hispanic Black | 11.17 (0.32) |
| Hispanic | 10.69 (0.28) |
| American Indian/Alaska Native | 0.68 (0.09) |
| Asian/Pacific Islander | 3.28 (0.14) |
| Non-Hispanic other | 0.30 (0.05) |
| Nativity/immigrant status | |
| Foreign-born | 13.63 (0.29) |
| US-born1 | 86.37 (0.29) |
| Education | |
| Less than high school | 15.24 (0.27) |
| High school | 31.62 (0.37) |
| Some college | 29.43 (0.33) |
| College | 23.70 (0.36) |
| Marital status | |
| Currently married | 58.46 (0.38) |
| Widowed | 6.59 (0.15) |
| Divorced/separated | 12.64 (0.20) |
| Never married | 22.31 (0.34) |
| Poverty status2 (%) | |
| <100 | 8.36 (0.23) |
| >=100&<200 | 13.40 (0.25) |
| >=200&<400 | 25.61 (0.33) |
| >=400 | 31.89 (0.40) |
| Missing | 20.74 (0.38) |
| Housing tenure (home ownership) | |
| Renter | 29.50 (0.47) |
| Owner | 70.50 (0.47) |
| Region | |
| Northeast | 18.82 (0.36) |
| North Central/Midwest | 24.56 (0.44) |
| South | 37.19 (0.46) |
| West | 19.43 (0.38) |
| Activity limitation3 | |
| No | 85.19 (0.27) |
| Yes | 14.81 (0.27) |
| Body mass index (BMI) | |
| <25 | 40.43 (0.38) |
| =>25 & <30 | 34.49 (0.34) |
| =>30 & <40 | 19.39 (0.29) |
| =>40 | 5.70 (0.16) |
| Smoking status | |
| Never smoker | 54.61 (0.38) |
| Former smoker | 22.43 (0.29) |
| Current smoker | 22.96 (0.31) |
| Alcohol consumption | |
| Lifetime abstainer | 21.67 (0.37) |
| Former drinker | 14.63 (0.28) |
| Current drinker | 62.82 (0.39) |
| Unknown | 0.88 (0.09) |
SE=standard errors. 1US-born refers to those who were born in the one of the 50 states, or District of Columbia. 2Ratio of family income to poverty threshold. 3Activity limitation indicates whether a person has any limitation in activities listed in nhis survey questionnaire including instrumental activities of daily living (IADL), activities of daily living (ADL), working at a job, walking, or remembering.
3.2. Estimated Life Expectancies at Selected Ages at Baseline
Table 2 presents estimated life expectancies for both male and female adults. For adults at age 18, the estimated life expectancy was 54.10 years. The estimated life expectancies for adults with lower levels of happiness or life satisfaction were shorter than those for adults with higher levels of happiness or life satisfaction, regardless of age or gender. At age 18, adults reporting happiness none or a little of the time had 7.45 years shorter life expectancy, compared with adults reporting happiness all of the time. Adults experiencing happiness some of the time had 2.48 years shorter life expectancy at age 18, compared with adults reporting happiness all of the time. Adults who were happy none or a little of the time had 6.44 and 3.71 years shorter life expectancy at ages 45 and 65, respectively, compared with adults who were happy all of the time. Both males and females who were happy none or a little of the time had substantially lower life expectancy than those who were happy all of the time.
| Happiness/Life Satisfaction | Both Sexes | Male | Female | ||||||
|---|---|---|---|---|---|---|---|---|---|
| LE | SE | Dif. | LE | SE | Dif. | LE | SE | Dif. | |
| Sample size | 30,377 | 13,194 | 17,183 | ||||||
| Overall | |||||||||
| Age 18 | 54.10 | 0.20 | 51.67 | 0.29 | 56.041 | 0.26 | |||
| Age 45 | 29.94 | 0.17 | 27.79 | 0.25 | 31.62 | 0.23 | |||
| Age 65 | 15.31 | 0.15 | 13.92 | 0.23 | 16.22 | 0.19 | |||
| Happiness | |||||||||
| Age 18 | |||||||||
| None / a little of the time | 47.05 | 0.89 | -7.45*** | 43.76 | 1.40 | -7.64*** | 49.52 | 1.16 | -7.84*** |
| Some of the time | 52.02 | 0.46 | -2.48*** | 49.30 | 0.70 | -2.10** | 54.09 | 0.61 | -3.27*** |
| Most of the time | 55.28 | 0.25 | 0.78* | 53.16 | 0.38 | 1.76** | 56.87 | 0.34 | -0.49 |
| All of the time | 54.50 | 0.50 | 0.00 | 51.40 | 0.74 | 0.00 | 57.36 | 0.67 | 0.00 |
| Age 45 | |||||||||
| None / a little of the time | 24.41 | 0.67 | -6.44*** | 22.34 | 0.94 | -6.04*** | 26.06 | 0.93 | -7.02*** |
| Some of the time | 28.29 | 0.39 | -2.56*** | 26.05 | 0.58 | -2.33*** | 29.97 | 0.52 | -3.11*** |
| Most of the time | 30.73 | 0.22 | -0.12 | 28.71 | 0.34 | 0.33 | 32.20 | 0.29 | -0.88* |
| All of the time | 30.85 | 0.42 | 0.00 | 28.38 | 0.61 | 0.00 | 33.08 | 0.57 | 0.00 |
| Age 65 | |||||||||
| None / a little of the time | 12.67 | 0.61 | -3.71*** | 11.56 | 0.86 | -3.19*** | 13.41 | 0.86 | -4.13*** |
| Some of the time | 14.40 | 0.35 | -1.98*** | 13.23 | 0.55 | -1.52** | 15.11 | 0.46 | -2.43*** |
| Most of the time | 15.43 | 0.20 | -0.95** | 14.03 | 0.30 | -0.72 | 16.30 | 0.25 | -1.24*** |
| All of the time | 16.38 | 0.33 | 0.00 | 14.75 | 0.50 | 0.00 | 17.54 | 0.43 | 0.00 |
| Life satisfaction | |||||||||
| Age 18 | |||||||||
| Very dissatisfied or dissatisfied | 47.35 | 0.74 | -8.90*** | 43.63 | 1.07 | -10.12*** | 50.27 | 0.99 | -8.12*** |
| Satisfied | 53.43 | 0.28 | -2.82*** | 51.10 | 0.41 | -2.65*** | 55.18 | 0.36 | -3.21*** |
| Very satisfied | 56.25 | 0.31 | 0.00 | 53.75 | 0.45 | 0.00 | 58.39 | 0.42 | 0.00 |
| Age 45 | |||||||||
| Very dissatisfied or dissatisfied | 24.37 | 0.61 | -7.19*** | 21.56 | 0.83 | -7.76*** | 26.57 | 0.85 | -6.88*** |
| Satisfied | 29.51 | 0.24 | -2.05*** | 27.37 | 0.36 | -1.95*** | 31.05 | 0.31 | -2.40*** |
| Very satisfied | 31.56 | 0.27 | 0.00 | 29.32 | 0.39 | 0.00 | 33.45 | 0.36 | 0.00 |
| Age 65 | |||||||||
| Very dissatisfied or dissatisfied | 12.59 | 0.62 | -3.59*** | 10.42 | 0.89 | -4.29*** | 14.09 | 0.82 | -3.18*** |
| Satisfied | 14.86 | 0.20 | -1.32*** | 13.46 | 0.33 | -1.25*** | 15.65 | 0.26 | -1.62*** |
| Very satisfied | 16.18 | 0.23 | 0.00 | 14.71 | 0.33 | 0.00 | 17.27 | 0.31 | 0.00 |
LE=life expectancy. Dif.=Differences from reference group. 1Differences in life expectancy between males and females for all variables were statistically significant (p<0.001).
Regarding life satisfaction, we found that at age 18, adults who were very dissatisfied or dissatisfied with their life in general had 8.9 years shorter life expectancy than those who were very satisfied. Adults who were satisfied with their life had 2.82 years shorter life expectancy than those who were very satisfied with their life. Adults at ages 45 and 65 who were very dissatisfied or dissatisfied had shorter life expectancy by 7.19 and 3.59 years, respectively, compared with adults who were very satisfied with their life. Both males and females who were very dissatisfied or dissatisfied had lower life expectancies than those who were very satisfied with their life.
Patterns in life expectancy associated with happiness and life satisfaction differed between men and women (Table 2). The impact of happiness on life expectancy was greater for women than men, particularly at older ages. At age 45, women being happy none or a little of the time had 7 year shorter life expectancy than women who were happy all of the time, while men being happy none or a little of the time had 6 years shorter life expectances than men who were happy all of the time. However, life satisfaction had a stronger impact on life expectancy of men than that of women. Compared with their counterparts who reported high life satisfaction, men with low life satisfaction had 10 years shorter life expectancy, whereas women with low life satisfaction had 8 years shorter life expectancy.
Figure 1 provides age-specific life expectancies by levels of happiness and life satisfaction. Consistent with the findings above, these curves indicate higher life expectancies for adults with lower levels of happiness and life satisfaction at each age. For example, at age 65, the difference between the highest and lowest levels of happiness was 3.7 years (16.4 vs. 12.7 years); the difference between the highest and lowest levels of life satisfaction was 3.6 years (16.2 vs. 12.6 years).
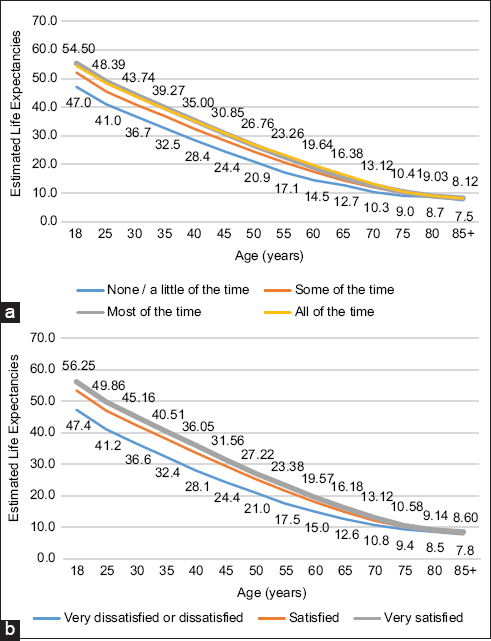
- (a, b). Age-specific life expectancies by levels of happiness and life satisfaction, United States, 2001-2014
3.3. Cox Proportional Hazards Models
Table 3 provides age-adjusted mortality rates per 100,000 person-years by happiness and life satisfaction categories, and age-adjusted and covariate-adjusted hazard ratios (HRs). Adults with lower levels of happiness and life satisfaction had higher age-adjusted mortality rates. The age-adjusted mortality rate for adults with “none or a little of the time” happiness was 2,367.98 per 100,000 person-years, 53% higher than the mortality rate of 1,550.22 for adults with “all of the time” happiness. In Cox regression models, controlling for age, the mortality risk was 82% higher (HR=1.82; 95% CI: 1.59,2.08) in adults with “none or a little of the time” happiness, compared with adult with “all of the time” happiness. After controlling for socioeconomic and demographic covariates, the mortality risk was 71% higher (HR=1.71; 95% CI=1.50,1.96; data not shown) in adults with “none or a little of the time” happiness, compared to adults with “all of the time” happiness. After controlling for all covariates, the mortality risk was 36% higher (HR=1.36; 95% CI=1.17,1.57) in adults with “none or a little of the time” happiness, compared to those with “all of the time” happiness.
| Covariates | Mortality Rate | Cox Model HR (95% CI) | ||
|---|---|---|---|---|
| Age-adjusted mortality Rate1 (SE) | Rate ratio | Age-adjusted2 | Covariate-adjusted3 | |
| Sample size | 30,377 | 30,377 | 30,377 | |
| Overall | 1624.70 (22.04) | |||
| Happiness | ||||
| None / a little of the time | 2367.98 (119.56) | 1.53***4 | 1.82*** (1.59,2.08) | 1.36*** (1.17,1.57) |
| Some of the time | 1828.92 (54.83) | 1.18*** | 1.25*** (1.12,1.41) | 1.10 (0.97,1.24) |
| Most of the time | 1535.63 (28.28) | 0.99 | 0.97 (0.89,1.06) | 1.00 (0.91,1.10) |
| All of the time | 1550.22 (50.25) | 1.00 | 1.00 | 1.00 |
| Life satisfaction5 | ||||
| Very dissatisfied or dissatisfied | 2336.71 (109.27) | 1.62*** | 2.07*** (1.80,2.38) | 1.39*** (1.20,1.60) |
| Satisfied | 1688.50 (31.12) | 1.17*** | 1.29*** (1.20,1.39) | 1.11*** (1.03,1.20) |
| Very satisfied | 1446.59 (32.30) | 1.00 | 1.00 | 1.00 |
| Social support | ||||
| Never/rarely | 3903.44 (192.33) | 1.26*** | 0.91 (0.80,1.05) | |
| Sometimes | 3535.21 (125.6) | 1.14*** | 0.92*** (0.83,1.01) | |
| Usually | 3085.05 (75.02) | 0.99 | 0.94 (0.86,1.02) | |
| Always | 3104.81 (62.9) | 1.00 | 1.00 | |
| Missing | 3832.3 (588.3) | 1.23 | 0.78*** (0.58,1.05) | |
| Sex | ||||
| Male | 1898.66 (39.09) | 1.00 | ||
| Female | 1445.81 (26.36) | 0.76*** | 0.63*** (0.58,0.68) | |
| Race/ethnicity | ||||
| Non-Hispanic White | 3046.28 (49.80) | 1.00 | 1.00 | |
| Non-Hispanic Black | 3713.84 (130.62) | 1.22*** | 1.05 (0.94,1.18) | |
| Hispanic | 3282.11 (130.68) | 1.08** | 1 (0.87,1.16) | |
| American Indian/Alaska Native | 3664.18 (612.24) | 1.20 | 0.85 (0.61,1.18) | |
| Asian/Pacific Islander | 2751.36 (305.59) | 0.90 | 1.16 (0.9,1.50) | |
| Non-Hispanic other | 2047.67 (713.25) | 0.67* | 0.71 (0.34,1.49) | |
| Nativity/immigrant status | ||||
| US-born | 1422.33 (59.09) | 1.00 | 1.00 | |
| Foreign-born | 1646.99 (23.71) | 1.16*** | 0.90* (0.80,1.00) | |
| Education | ||||
| Less than high school | 2046.81 (50.52) | 1.65*** | 1.40*** (1.24,1.58) | |
| High school | 1691.16 (40.10) | 1.37*** | 1.30*** (1.17,1.44) | |
| Some college | 1580.34 (49.40) | 1.28*** | 1.26*** (1.12,1.41) | |
| College | 1237.39 (50.61) | 1.00 | ||
| Marital status | ||||
| Currently married | 1525.21 (38.56) | 1.00 | 1.00 | |
| Widowed | 1725.65 (76.07) | 1.13*** | 1.16*** (1.07,1.26) | |
| Divorced/separated | 1770.47 (76.75) | 1.16*** | 1.12** (1.02,1.23) | |
| Never married | 1798.12 (96.97) | 1.18*** | 1.40*** (1.22,1.61) | |
| Poverty status (%) | ||||
| <100 | 2264.95 (80.14) | 1.71*** | 1.25*** (1.10,1.42) | |
| >=100&<200 | 2004.72 (58.48) | 1.52*** | 1.19*** (1.05,1.34) | |
| >=200&<400 | 1625.79 (49.68) | 1.23*** | 1.12* (1.00,1.26) | |
| >=400 | 1322.02 (59.40) | 1.00 | 1.00 | |
| Missing | 1560.67 (40.99) | 1.18*** | 1.18*** (1.06,1.32) | |
| Housing tenure (home ownership) | ||||
| Renter | 2040.26 (49.64) | 1.37*** | 1.21*** (1.11,1.32) | |
| Owner | 1494.69 (25.02) | 1.00 | 1.00 | |
| Region | ||||
| Northeast | 1531.18 (48.57) | 0.96 | 0.99 (0.90,1.09) | |
| North Central/Midwest | 1601.07 (45.60) | 1.01 | 0.97 (0.89,1.06) | |
| South | 1704.06 (36.97) | 1.07** | 1.07 (0.98,1.17) | |
| West | 1590.63 (48.8) | 1.00 | 1.00 | |
| Activity limitation | ||||
| No | 1373.48 (27.19) | 1.00 | 1.00 | |
| Yes | 2519.59 (57.37) | 1.83*** | 1.79*** (1.67,1.92) | |
| Body mass index (BMI) | ||||
| <25 | 1640.88 (34.66) | 1.00 | 1.00 | |
| =>25 & <30 | 1523.64 (36.47) | 0.93** | 0.85*** (0.78,0.92) | |
| =>30 & <40 | 1679.62 (60.20) | 1.02 | 0.94 (0.86,1.02) | |
| =>40 | 1866.89 (110.64) | 1.14** | 1.11 (0.95,1.28) | |
| Smoking status | ||||
| Never smoker | 1312.15 (26.83) | 1.00 | 1.00 | |
| Former smoker | 1661.11 (40.22) | 1.27*** | 1.21*** (1.12,1.30) | |
| Current smoker | 2467.53 (101.50) | 1.88*** | 1.92*** (1.75,2.11) | |
| Alcohol consumption | ||||
| Lifetime abstainer | 1543.96 (39.52) | 1.00 | 1.00 | |
| Former drinker | 2041.35 (53.85) | 1.32*** | 1.12*** (1.03,1.23) | |
| Current drinker | 1519.15 (34.22) | 0.98 | 0.88*** (0.82,0.96) | |
| Unknown | 1624.65 (242.69) | 1.05 | 0.81 (0.55,1.18) | |
The age-adjusted mortality rate for adults who were very dissatisfied or dissatisfied with their life was 2,336.71 per 100,000 person-years, 62% higher than the rate of 1,446.59 for adults who were very satisfied (Table 3). In Cox models, controlling for age, the mortality risk was 107% higher (HR=2.07; 95% CI=1.80,2.38) in adults who were very dissatisfied or dissatisfied with their life, compared with adults who were very satisfied. After controlling for socioeconomic and demographic covariates, the mortality risk was 71% higher (HR=1.71; 95% CI=1.50,1.95; data not shown) in adults who were very dissatisfied or dissatisfied, compared with adults who were very satisfied. After controlling for all covariates, the mortality risk was 39% higher (HR=1.39; 95% CI=1.20,1.60) in adults who were very dissatisfied or dissatisfied with their life, compared with adults who were very satisfied.
4. Discussion
In this large prospective study of 30,377 US adults using a relatively long mortality follow-up of 14 years, we found that adults with lower levels of happiness and life satisfaction had substantially higher mortality risks and lower life expectancy. Even after controlling for several sociodemographic, health status, and behavioral characteristics, significantly higher risks of all-cause mortality existed for the total population who did not experience happiness or were dissatisfied, compared with those who reported happiness all of the time or those who were very satisfied with their lives. Our study is also unique and novel in that it provides life expectancy estimates for Americans with varying levels of happiness and life satisfaction, a set of findings that have not been previously reported, to the best of our knowledge.
The findings of our study are largely consistent with those from previous studies of happiness/life satisfaction and all-cause mortality.2,4–7,10 Martin-Maria and colleagues found that the pooled HR for the effect of subjective well-being including happiness and life satisfaction on mortality was 0.92 in their meta-analysis using 90 studies.10 In our study, the age-adjusted relative risk of all-cause mortality associated with dissatisfaction was 2.07, compared with 2.11 in the Finish study.6 In our full model with controls for sociodemographic characteristics, health status, and behavioral risk factors of smoking, alcohol consumption, and obesity, the adjusted risk of all-cause mortality associated with dissatisfaction was 1.39, compared with 1.49 in the Finish study with slightly different covariates.6
Our study has provided evidence of a strong link between happiness/life satisfaction and all-cause mortality, but does not shed any light on behavioral or biological mechanisms through which happiness/life satisfaction might affect the development of specific diseases leading up to mortality. One potential mechanism is that individuals with greater happiness/life satisfaction levels have healthier lifestyles, including greater physical activity, more consumption of fruits and vegetables, less alcohol consumption or smoking, and having more preventive care, resulting in a reduction in their morbidity and mortality risks.2 The other mechanisms might involve biological processes of happiness relevant to health such as biomarker neuroendocrine, inflammation, cardiovascular disease, metabolic, or allostatic load.2 There are an array of risk factors for or determinants of happiness/life satisfaction, such as personality, genetics, stress exposure, social support or network, race/ethnicity, socioeconomic status including income and education, marital status, physical activity, and health status.2,21 For example, both non-Hispanic Blacks and Hispanics are less likely to report high levels of life satisfaction than non-Hispanic Whites.21 In our analysis, we controlled for several of these factors, which are associated with both happiness/life satisfaction and all-cause mortality in an expected manner.2,3,9,21 Further research is needed to examine differential associations between happiness or life satisfaction and all-cause and cause-specific mortality by these factors or pathways.
4.1. Limitations
There are several limitations in this study. First, our study only contains NHIS sample eligible for linkage to the NDI. Excluding sample ineligible for linkage may lead to biased mortality estimates. To address this bias, we used the adjusted original sampling weight to account for the NHIS-NDI mismatches.19 Second, there could be omitted-variable bias. While our Cox regression models controlled for self-reported health status including BMI and activity limitation, there could be potential confounders such as neighborhood environments or periods of economic downturn. Third, our measures of happiness and life satisfaction might not capture all aspects of subjective well-being. In further studies, the realization of personal potential and the fulfillment of life goals2 or combined scale of multiple items22, or specified measures of happiness in such domains as marriage/family, job, and financial situation23 could be used as an alternative measures. Fourth, since the NHIS excludes the institutionalized population, who may have lower levels of happiness/life satisfaction and higher mortality, mortality risks associated with happiness/life satisfaction in this study might be underestimated. Fifth, all the covariates in the NHIS-NDI database were time-fixed at the baseline as of the survey date. Several of the covariates such as socioeconomic status, health status, behavioral risk factors, and happiness/life satisfaction could have varied over the long mortality follow-up period of 14 years, which would have influenced their estimated impact on all-cause mortality. Further studies are needed to evaluate the temporal robustness of happiness/life satisfaction patterns in all-cause mortality using longitudinal datasets with time-varying covariates.
5. Conclusions and Global Health Implications
With 14 years of mortality follow-up in a large, nationally representative study of 30,377 US adults aged ≥18 years, we found that males and females with low levels of happiness and life satisfaction had 8 to 10 years of shorter life expectancy and a two-fold higher age-adjusted risk of all-cause mortality compared to those with high levels of happiness and life satisfaction. The association between happiness/life satisfaction and all-cause mortality remained marked and statistically significant even after controlling for several sociodemographic, behavioral, and health characteristics. Our study findings indicate happiness/life satisfaction to be an important predictor of all-cause mortality; they underscore the significance of enhancing subjective well-being in the general population as a potential strategy for reducing mortality and increasing life expectancy. Many of the social determinants such as education, income, work status, job security, housing conditions, social support, social environment, and access to green spaces and quality health care are key to enhancing happiness and life satisfaction.24 Social policies addressing these social determinants will not only promote happiness and well-being among people, but may also lead to marked improvements in life expectancy and mortality.
Conflict of Interest: The authors have no conflicts of interest to disclose.
Funding/Support: Dr. Lee was supported in part by an appointment to the Research Participation Program at the Health Resources & Services Administration - Office of Planning, Analysis and Evaluation (HRSA-OPAE), administered by the Oak Ridge Institute for Science and Education (ORISE) through an interagency agreement between the US Department of Energy and HRSA.
Financial Disclosure: The authors have no financial relationships relevant to this article to disclose.
Ethical Approval: The study was exempt from Institutional Review Board approval as it utilized a de-identified public use dataset.
Disclaimer: The views expressed in this publication are solely the opinions of the authors and do not necessarily reflect the official policies of US Department of Health and Human Services, Health Resources and Services Administration, nor does mention of the department or agency names imply endorsement by the US Government.
References
- World Happiness Report 2020
- Happiness and Health. Annu Rev Public Health. 2019;40(1):339-359. doi:10.1146/annurev-publhealth-040218-044150
- [Google Scholar]
- Happiness and life satisfaction prospectively predict self-rated health, physical health, and the presence of limiting, long-term health conditions. Am J Heal Promot. 2008;23(1):18-26.
- [Google Scholar]
- The role of life satisfaction and depressive symptoms in all-cause mortality. Psychol Aging. 2009;24(3):696.
- [Google Scholar]
- Happy people live longer:Subjective well-being contributes to health and longevity. Appl Psychol Heal Well-Being. 2011;3(1):1-43.
- [Google Scholar]
- Self-reported life satisfaction and 20-year mortality in healthy Finnish adults. Am J Epidemiol. 2000;152(10):983-991.
- [Google Scholar]
- The power of positive emotions:It's a matter of life or death—Subjective well-being and longevity over 28 years in a general population. Health Psychol. 2010;29(1):9-19.
- [Google Scholar]
- Happiness and health:Lessons—and questions—for public policy. Health Aff. 2008;27(1):72-87.
- [Google Scholar]
- The impact of subjective well-being on mortality:a meta-analysis of longitudinal studies in the general population. Psychosom Med. 2017;79(5):565-575.
- [Google Scholar]
- Psychological well-being, cardiorespiratory fitness, and long-term survival. Am J Prev Med. 2010;39(5):440-448.
- [Google Scholar]
- Does happiness itself directly affect mortality?The prospective UK Million Women Study. Lancet. 2016;387(10021):874-881.
- [Google Scholar]
- IPUMS Health Surveys:National Health Interview Survey, Version 6.4 [dataset] 2019 doi:https://doi.org/10.18128/D070.V6.4
- Office of Analysis and Epidemiology Public-Use Linked Mortality File 2015
- It is better to be a fat ex-smoker than a thin smoker:findings from the 1997–2004 National Health Interview Survey- National Death Index linkage study. Tob Control. 2014;23(5):395-402.
- [Google Scholar]
- Applied Longitudinal Data Analysis:Modeling Change and Event Occurrence. Oxford University Press 2003
- [Google Scholar]
- Methodology Overview and Analytic Considerations
- Stata Statistical Software:Release 15 2017
- The relative contributions of race/ethnicity, socioeconomic status, health, and social relationships to life satisfaction in the United States. Qual Life Res. 2009;18(2):179-189.
- [Google Scholar]
- A measure of subjective happiness:Preliminary reliability and construct validation. Soc Indic Res. 1999;46(2):137-155.
- [Google Scholar]
- Addressing the social determinants of subjective wellbeing:the latest challenge for social policy. J Soc Policy. 2013;42(3):541-565.
- [Google Scholar]